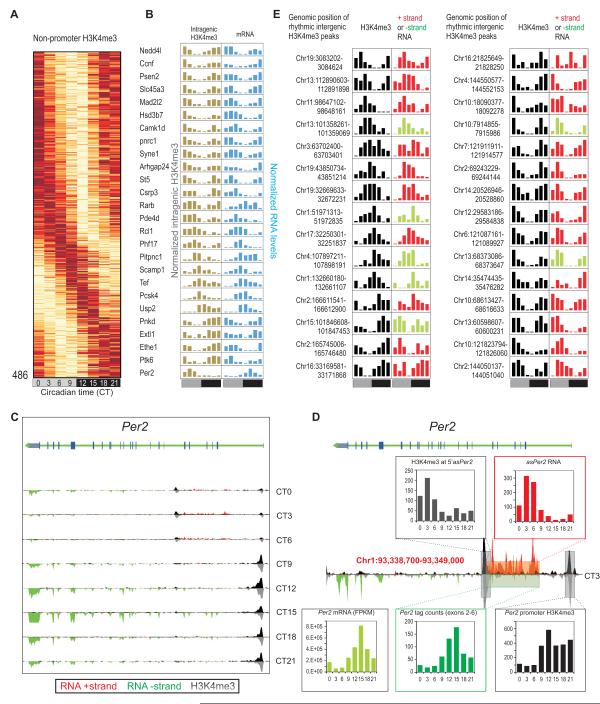
Figure 4. Oscillating H3K4me3 marks unannotated transcribed loci including asPer2.
(A) Heatmap rendering of oscillating non-promoter H3K4me3. (B) Examples of genes with intragenic oscillating H3K4me3 and oscillating transcripts showing temporally correlated H3K4me3 and transcript rhythms except Per2. (C) Per2 locus shows rhythmic expression of both sense and an antisense transcript. Transcript (red/green) and H3K4me3 (black/grey) levels, binned in 150 bp bins for both ‘+’ and ‘−’ strands are shown. (D) Data for CT3 is shown magnified to highlight the asPer2 transcript. Inset histograms report oscillations in H3K4me3 levels at the potential TSS of asPer2, asPer2 RNA levels, Per2 mRNA, transcript from the sense strand in the regions corresponding to the asPer2 transcript, and rhythm in H3K4me3 at the Per2 TSS. Corresponding regions of the locus are shown in colored boxes. (E) Examples of oscillating intergenic H3K4me3 peaks and associated transcripts. Normalized H3K4me3 levels (black) and transcript tag counts from the plus strand (red) or minus strand (green) in the proximal 10 kb region at eight time points through 24h are shown.

