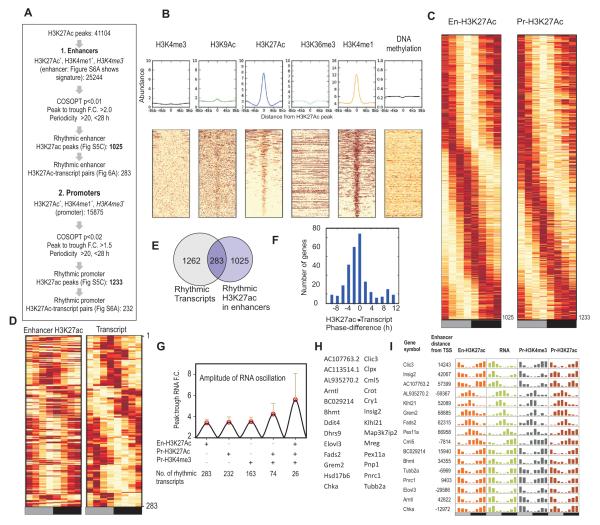
Figure 5. H3K27ac defines oscillating enhancers.
(A) Flowchart for identification of rhythmic H3K27ac at enhancers and promoters. (B) Histogram and heatmap rendering of various histone modifications and DNA methylation levels at enhancers. (C) Heatmap representation of oscillating H3K27ac at enhancers and promoters. (D) Heatmap representation and (E) Venn diagram of 283 oscillating enhancers and proximal (within 200kb) oscillating transcripts. (F) Difference in peak phase between RNA and enhancer H3K27ac is shown as a histogram. H3K27ac levels preceded RNA levels. (G) Synchronous histone modification rhythms correlate with improved amplitude of transcript oscillations. Average (+ s.d.) peak:trough ratio (amplitude) of oscillating transcripts with oscillating enhancer H3K27ac, promoter H3K27ac, promoter H3K4me3 or combinations of histone modification rhythms are shown. Number of transcripts that meet these criteria are shown below. (H). Gene names of 26 loci and (I) example loci with robust oscillations in RNA, promoter H3K4me3, promoter H3K27ac and enhancer H3K27ac

