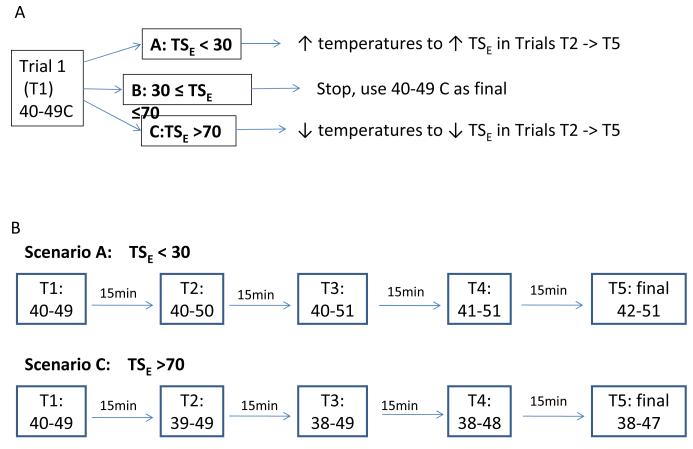
Figure 1.
Algorithm to individually optimize TS.
a) Overall Scheme after Trial 1 (T1).
b) Specific algorithms for scenario A and C, where TS is <30 or >70, respectively. T1 = 1st optimization trial, T2 -> T5 = 2nd to 5th optimization trials. Each participant is allowed to have no more than 5 optimization trials.

