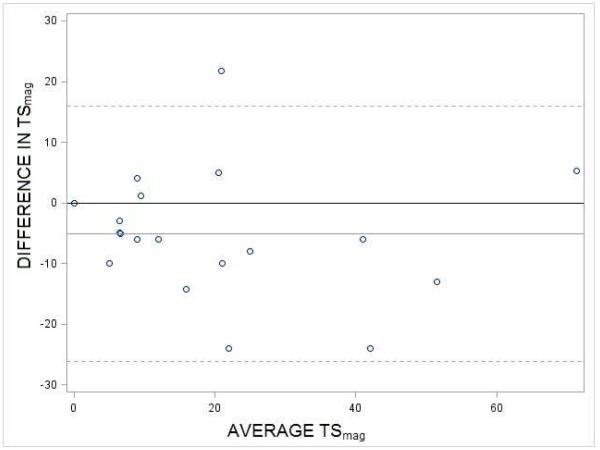
Figure 4.
Bland-Altman plot of TS from the first trials on Day 4 and Day 11. Each circle represents one of the 19 participants. Mean difference in 1st TS of (Day 4 - Day 11) = −5.1 (gray line). The 95% CL is between −0.03 and −10.1. The hashed lines represent 2 standard deviations above and below the mean.

