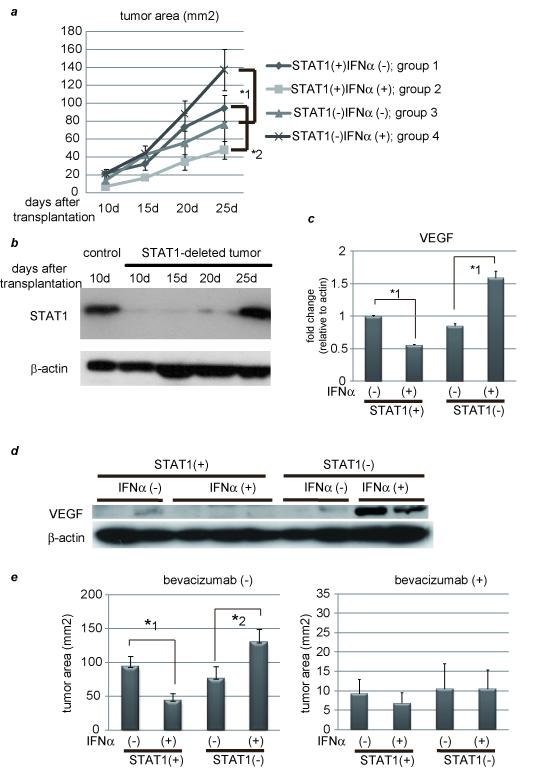
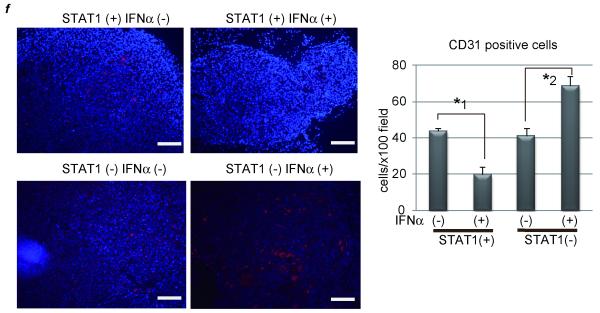
Figure 2. IFNα has an inhibitory effect on tumor development in the presence of STAT1 but an opposite effect in the absence of STAT1.
(a) PLC/PRF/5 cells were transfected with control siRNA (group 1 and 2) or siRNA for STAT1 (group 3 and 4). One day after treatment, 5 × 10⁶ of these cells were subcutaneously injected to Balb/c nude mice, and tumor area was measured every 5 days. In two groups (group 2 and 4), 5 × 10⁴ IU/mouse of IFNα were administered IP every day, and in the other groups (group 1 and 3) the same volume of 0.9% saline was injected as a control. The number of mice in each group was 5-7. (b) Expression levels of STAT1 as detected by western blot analysis. Each subcutaneous tumor in group 4 was removed at the different time points (10, 15, 20, 25 days after transplantation). One of tumors in group 2 was used as a positive control. (c) (d) Expression levels of VEGF as detected by real-time RT-PCR or western blot analysis. Each subcutaneous tumor was removed 20 days after transplantation. (e) Tumor area at 25 days after transplantation in each group in the absence (left panel) or presence (right panel) of bevacizumab, the monoclonal anti-VEGF antibody (N = 5-7 per group). Three days after injection of tumor cells, 10 mg/g body weight of bevacizumab were injected IP twice a week. (f) Immunofluorescent staining with anti-CD31 (red) antibody and Dapi (blue). Images are shown at low magnification (100×, left panel). Bars, 200 μm. The number of CD31-positive cells were presented (right panel). These data were acquired from three different fields in each tumor. Asterisks indicate significant differences (*1, P<.01, *2, P<.05).


