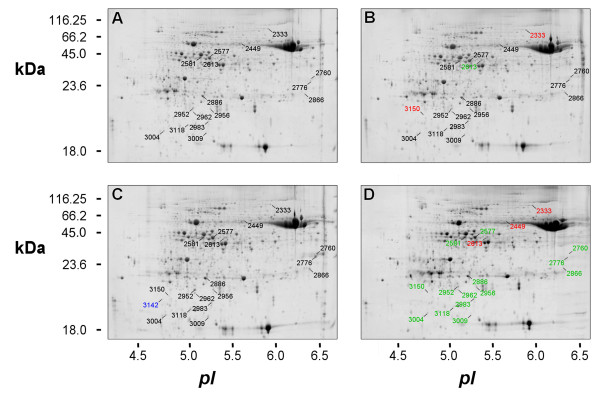
Figure 2.
2-DE maps. Representative 2-DE maps of soluble protein fractions extracted from Bowman and Bowman-Rph15 leaves at 4 days after mock inoculation (A and C, respectively) or after inoculation with leaf rust spores (B and D, respectively). Proteins (300 μg) were analyzed by IEF at pH 4–7, followed by 12.5% SDS-PAGE and visualized by SYPRO-staining. Numbers, corresponding to those in Table 1 and Figure 3, indicate the spots, identified by LC-ESI-MS/MS, showing significant changes of at least two-fold in their relative volumes (t-test, p < 0.05) after 4 dpi. Proteins that increased or decreased after this treatment are reported in red or in green, respectively. Spot 3142 is highlighted in blue, indicating its absence in the Bowman-Rph15 inoculated sample.

