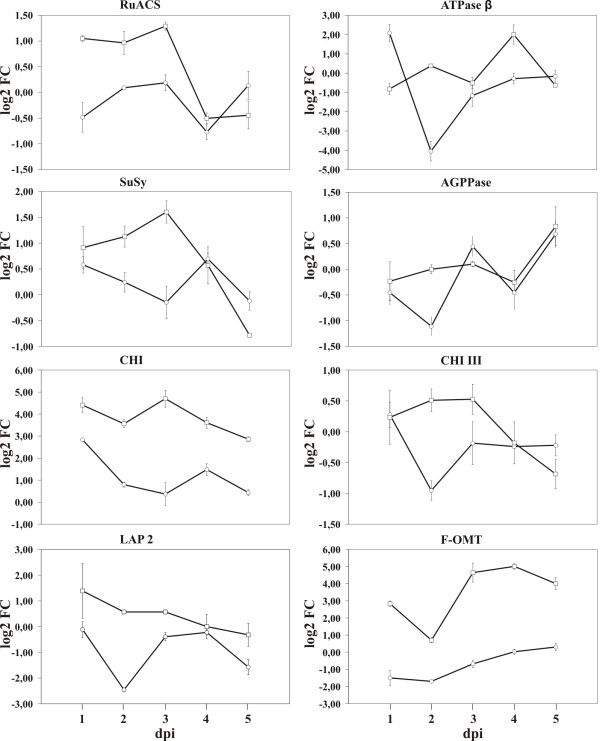
Figure 5.
Gene expression analysis of eight target genes. Quantitative RT-PCR at 1, 2, 3, 4 and 5 dpi for eight genes in leaves of Bowman (open circles) and Bowman-Rph15 (open squares). Values are expressed as log2 fold changes of transcript levels in the inoculated samples with respect to the transcript levels in mock-inoculated barley leaves. Numbers and name abbreviations are corresponding to those in Table 1. Error bars represent SD across all RT-PCR replicates (three from each of two independent inoculations). Statistical significance of differential expression for the tested genes was evaluated with a Wilcoxon two group test (P<0.05, Methods).

