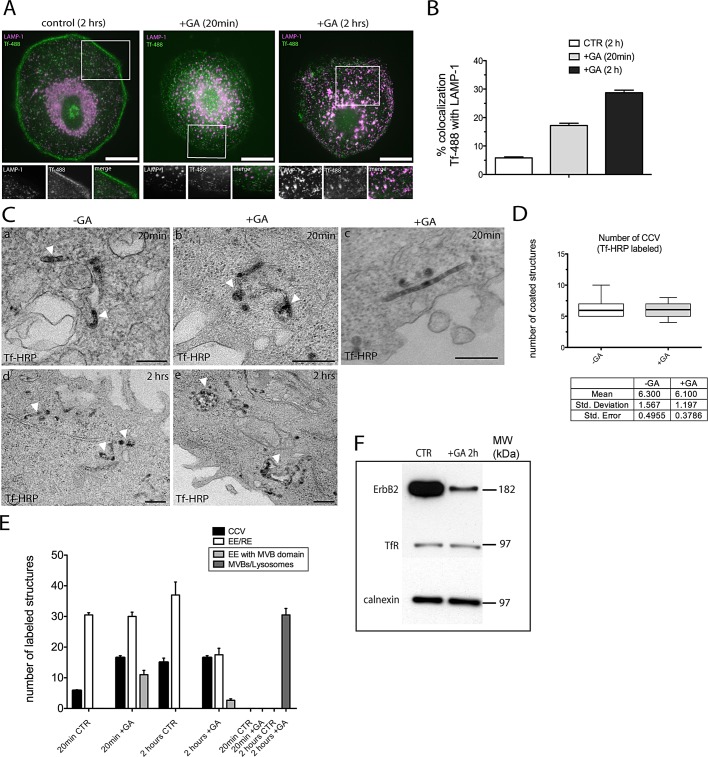
FIGURE 7:
GA impinges upon Tf recycling. (A) Immunofluorescence of Tf-488 uptake in control and GA-treated SK-BR-3 cells. Tf-488 was bound to the cell surface on ice for 15 min, either in the presence or in the absence of GA. Cells were washed and warmed at 37°C for different times, as indicated, and processed for immunofluorescence. Anti-LAMP1 antibody was used to label the lysosomal compartment (magenta). In contrast with untreated cells, Tf-488 localizes in LAMP-1 lysosomal compartments in GA-treated cells. Scale bars: 10 μm. (B) Colocalization between Tf-488 and LAMP-1 was quantified by pixel intensity in 10 cells over two independent experiments. The percentage of overlap was plotted as a bar graph. Bar and error bars show mean ± SEM. (C) TEM analysis of Tf-HRP uptake. Control and GA-treated SK-BR-3 were incubated with 1 mg/ml Tf-HRP for 15 min on ice, washed out in cold medium, and allowed to internalize at 37°C for the indicated time points. Cells were treated with DAB (+AA) to visualize the reaction product. Note that Tf-HRP is found in the MVB domain of EEs and in elongated tubules upon 20 min of GA treatment (b, arrowheads, and c). Sorting into MVB domain of EEs was not observed in untreated cells, in which Tf-HRP localized within EE/REs (a, arrowheads). After 2 h, Tf-HRP is found in EE/REs in untreated cells (d, arrowheads), whereas it is missorted to MVBs/lysosomes in cells treated with GA (e, arrowheads). Scale bars: 200 nm (a); 500 nm (b–e). (D) Box-and-whisker plot showing the quantification of Tf-HRP (+AA)-labeled clathrin-coated structures (±GA) upon 5 min of internalization in 10 cells across two independent experiments. Note that there is no difference in the number of internalized coated structures with/without treatment. (E) Quantification of Tf-HRP endocytic structures (±GA) performed in 10 cells across two independent experiments. Bars and error bars show mean ± SEM. CCVs were defined as coated vesicles, EE/REs as in Figure 7C (a and d, arrowheads), EEs with MVB domain as in Figure 7C (b, arrowheads), MVBs/lysosomes as in Figure 7C (e, arrowheads). Categories boxed are present only in GA-treated cells. (F) Western blot analysis of ErbB2 and TfR degradation upon GA treatment. TfR is not degraded compared with ErbB2 upon GA treatment (see Discussion).

