FIGURE 6:
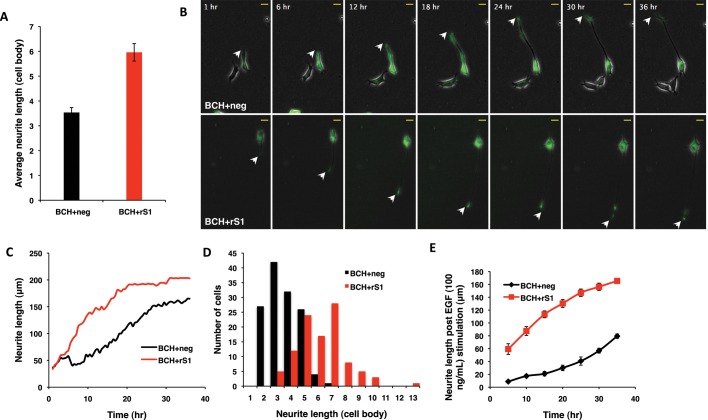
Knockdown of SmgGDS expression augments BCH domain–mediated PC12 cell differentiation. PC12 cells were transfected with BCH and pSilencer negative control (BCH+neg) or BCH and pSilencer rS1 (BCH+rS1), made quiescent, subjected to 100 ng/ml EGF stimulation, and imaged every 30 min for 36 h. Three independent experiments were conducted, and differentiated cells were then analyzed for neurite length, in terms of either cell body or micrometers. (A) Average length of neurites in knockdown (BCH+rS1) is ∼50% longer when compared with control (BCH+neg). Neurite lengths were measured for each cell in terms of cell body. Experiments were performed in triplicate, and the population means ± SEM (n = 3), p = 0.004, are plotted. (B) Representative cells from BCH+neg and BCH+rS1 were selected to show the neurite outgrowth over time. Images are snapshots of a time-course movie taken over 36 h, with white arrowheads indicating the tips of the neurites. (C) Neurite induction is advanced, and the initial rate of neurite outgrowth is higher for the knockdown than for the control. The graph tracks the neurite growth for one cell each from BCH+neg and BCH+rS1 and is plotted by measuring the neurite length of one representative cell per condition at each time point imaged. (D) There is a shift in the normal distribution of the population of cells with SmgGDS knockdown, to show the increased neurite length of the transfected cells. All the cells in the three experiments were plotted together to represent the population distribution of neurite lengths. (E) The population follows the same trend observed for representative cells in (C), with advanced neurite induction and a higher rate of growth for knockdown. Neurite growth of 10 cells with neurites of three cell body length (control) and 7 cell body length (knockdown) were traced every 5 h. Curves are means of neurite length at each time point ± SEM (n = 10).

