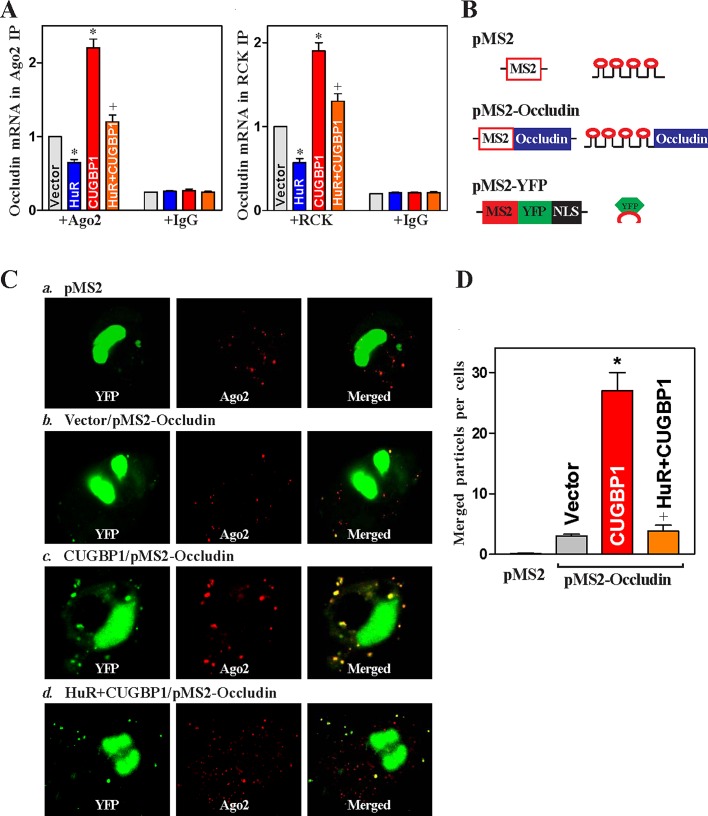
FIGURE 7:
HuR inhibits CUGBP1-induced occludin mRNA recruitment to P-bodies. (A) Interaction of occludin mRNA with components of P-bodies in cells overexpressing CUGBP1 or HuR alone, or both. After cells were transfected with the HuR or CUGBP1 expression vector alone or they were cotransfected with both HuR and CUGBP1 vectors for 48 h, the associations of occludin mRNA with Ago2 (left) and RCK (right) were measured by RNP-IP using anti-Ago2 or RCK antibodies, or control IgG followed by Q-PCR analysis. Values are means ± SEM of data from three separate experiments. *,+ p < 0.05 compared with cells transfected with control vector or cells transfected with the CUGBP1 expression vector, respectively. (B) Schematic of the plasmids used for the visualization of occludin mRNA. pMS2 and pMS2-occludin expressed MS2 and MS2-occludin RNAs, each containing 24 tandem MS2 hairpins; pMS2-YFP expressed a fusion fluorescent protein (MS2-YFP) capable of detecting MS2-containing RNA.. (C) Images of occludin mRNA colocalization with P-bodies: a) cells transfected with pMS2 alone; b) cells transfected with control vector and pMS2-occludin; c) cells transfected with CUGBP1 expression vector and pMS2-occludin; d) cells cotransfected with HuR and CUGBP1 expression vectors and with pMS2-occludin. Using confocal microscopy, MS2 and MS2-occludin mRNA were visualized using MS2-YFP (green fluorescence); red, Ago2 (P-body marker) signals; yellow, colocalized red and green signals. Three experiments were performed that showed similar results. (D) Quantification of the number of merged signals indicative of colocalization of MS2-occludin RNA and Ago2 signals in cells described in (C). Values are the means ± SEM of data from six samples. * p < 0.05 compared with cells transfected with control vector; + p < 0.05 compared with cells transfected with the CUGBP1 expression vector.

