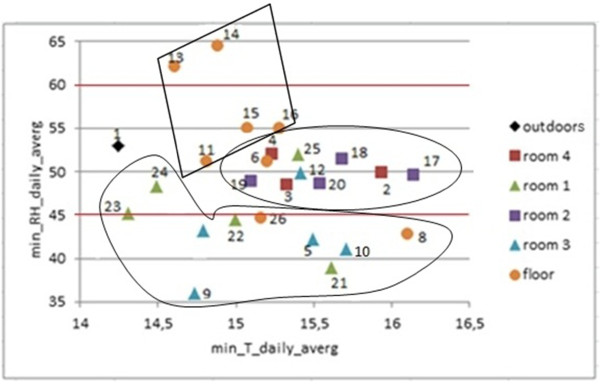
Figure 15.

Bivariate plot of daily minimum RH vs. temperature. Bivariate plot of daily minimum RH from each probe vs. daily minimum temperature, averaged for all the 372 days. Horizontal lines in red (45–60%) correspond to the range of RH recommended by the standard DM 10/2001 for the conservation of mural paintings.
