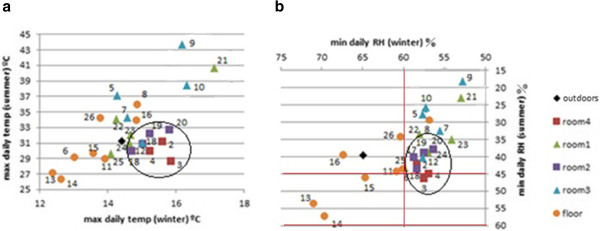
Figure 16.

Bivariate plots (summer vs. winter). a) Bivariate plot of daily maximum temperature (Tmax) averaged for the summer period (7/24/2008 – 9/22/2008) vs. Tmax averaged for the winter period (12/21/2008 – 3/31/2009). b) Bivariate plot of daily minimum RH (RHmin) in summer vs. RHmin in winter. Axes were inverted in the right plot to ease the comparison. Lines in red (45–60%) correspond to the range of RH recommended by the standard DM 10/2001.
