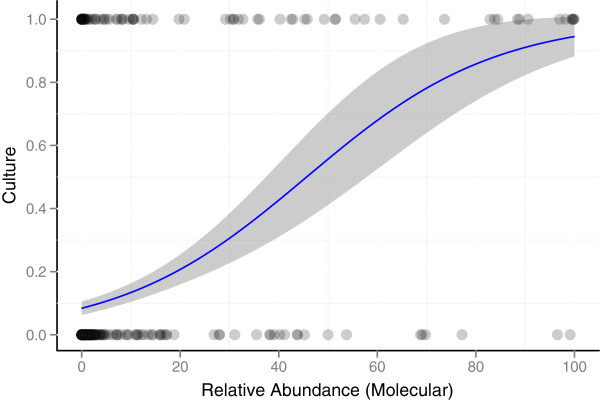
Figure 3.
Increased relative abundance of a bacterial genus increases the likelihood that the genus will be cultured. Each dot represents the detection of a bacterial genus by 16S DNA sequencing. Genera that were detected by culture (response = 1) are represented by dots at the top of the figure, and genera that were not cultured (response = 0) are represented as dots at the bottom of the figure. The proportion of occurrences that were detected by culture was modeled as a function of the observed relative abundance (as determined using molecular testing) using logistic regression (indicated by the blue line). The results demonstrate that an increased relative abundance of a bacterial genus subsequently increases the likelihood that the genus will be cultured. The shaded region indicates the 95% confidence interval of the predicted proportion.

