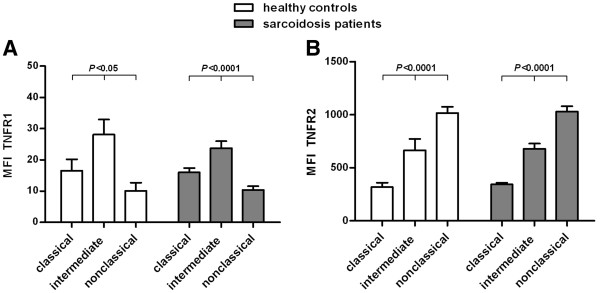
Figure 3.
Differential expression of TNFR1 and TNFR2 on monocyte subpopulations in sarcoidosis patients and healthy controls. Median fluorescence intensity (MFI) of TNFR1 (A) and TNFR2 (B) on classical (CD14++CD16−), intermediate (CD14++CD16+) and nonclassical (CD14+CD16++) monocytes in sarcoidosis patients (TNFR1 n = 18, TNFR2 n = 38) and in healthy controls (TNFR1 n = 5, TNFR2 n = 13) minus the MFI of the fluorescence minus one (FMO) control. Values are expressed as mean ± SEM. Both markers were significantly different between the three monocyte subpopulations. All monocytes expressed TNFR1, but intermediates had a higher expression of TNFR1 than classicals and nonclassicals. All monocytes also expressed TNFR2, but nonclassicals had a higher expression of TNFR2 than intermediates and a much higher expression than classicals. Comparison of the three subpopulations of monocytes was performed by a parametric One-way ANOVA.

