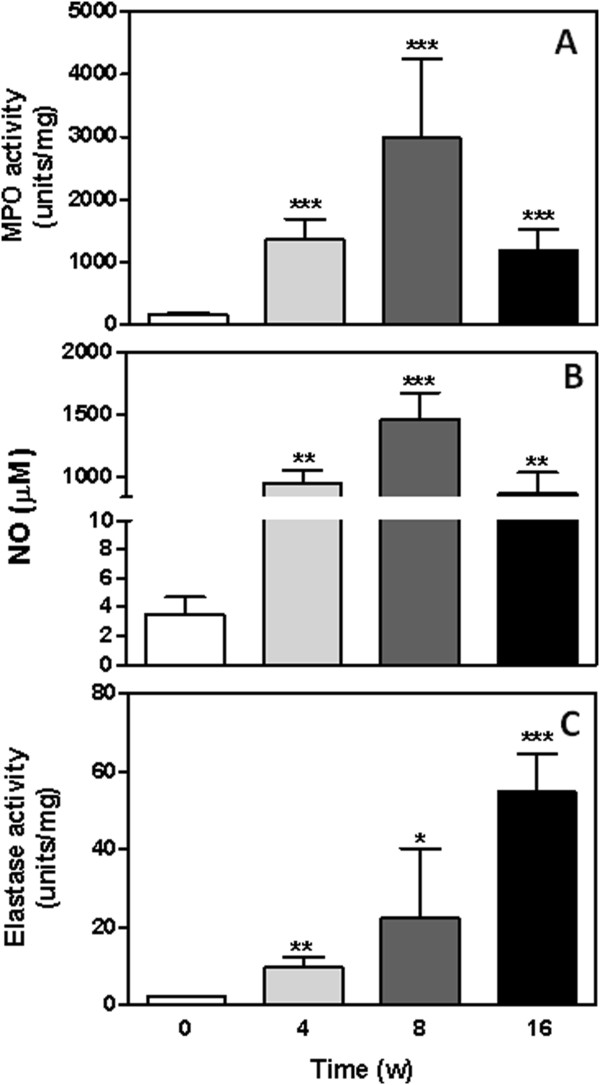
Figure 2.

MPO, NO and ELA levels in the tumour microenvironment. MPO (A), NO (B) and ELA (C) levels were analyzed in the tumor and control untreated tissue as described in the methods and materials section. Results are expressed as the mean ± SEM from each individual mouse analyzed. *P<0.05, **P<0.01 and *** P< 0.001.
