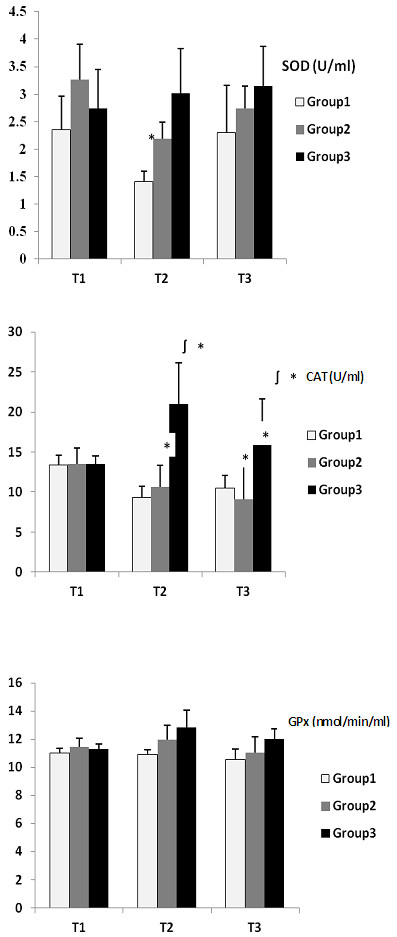
Figure 1.

Superoxide dismutase (SOD), catalase (CAT) and glutathione peroxidase (GPx) data in erythrocytes from dogs under anaesthesia. Data are expressed as the mean ± SD (n = 9). Group 1, 2% isoflurane; group 2, anaesthesia induced with an intravenous (IV) bolus dose of 6 mg/kg propofol, maintained with 1.5–2% isoflurane; group 3, total IV anaesthesia (induction with 6 mg/kg propofol and infusion with 0.6 mg/kg/min propofol). * Significantly different (P < 0.05) from T1. ∫ Significantly different (p < 0.05) from Group 1. T1; before anaesthesia, T2; end of anaesthesia, T3; 24 h after anaesthesia.
