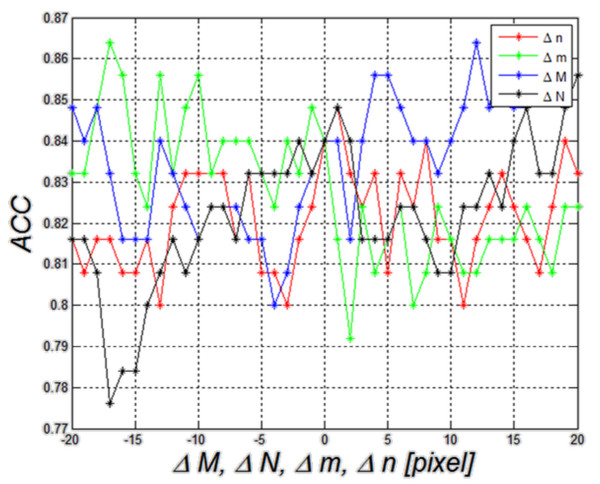
Figure 13.
Graph of changes in ACC as a function of Δm, Δn, ΔM and ΔN for linear dyscryminat analisys– this is the third described method (method 3). The graph shows that the value of ACC is 84% for Δm=Δn=ΔM=ΔN=0. The other values of ACC change in the range of about 5% for ROI shifts and size changes. The direction of these changes is different and it is difficult to clearly link it to ROI shift and resize.

