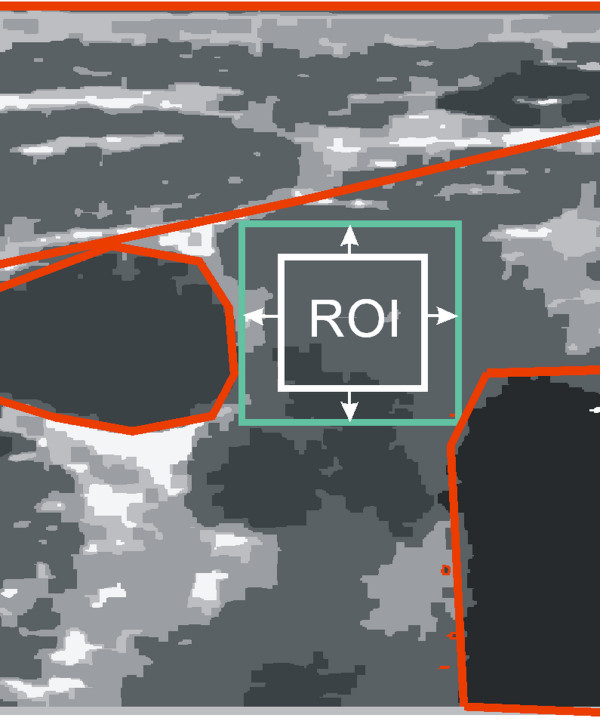
Figure 6.
The schematic diagram of the thyroid ultrasound image showing a typical distribution of the ROI (white) marked by a specialist physician and the distribution of adjacent organs (red). Acceptable ranges of variation in the ROI shift, size and rotation are highlighted in green. On this basis, and analyzing all the images, restrictions on ranges of variation in the ROI position and size were specified.

