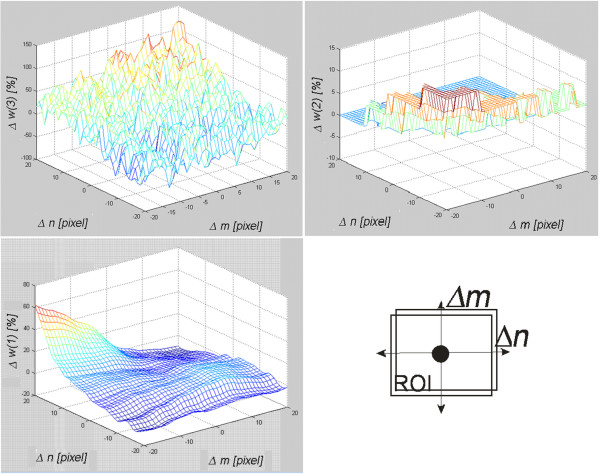
Figure 8.
Assessment of the algorithm sensitivity, w(1), w(2) and w(3) to the change of the analyzed area position in the range of ±20 pixels in rows (m) and columns (n). The graphs indicate that the shift of the ROI in the range of −20 pixels in both axes increases the value of the feature w(2) by about 10%. For the same shift, the values of the feature w(1) and w(3) do not change. The feature w(3) increases its error to the value of 60% but only for the shift of -20 pixels in one axis and +20 pixels in the other.

