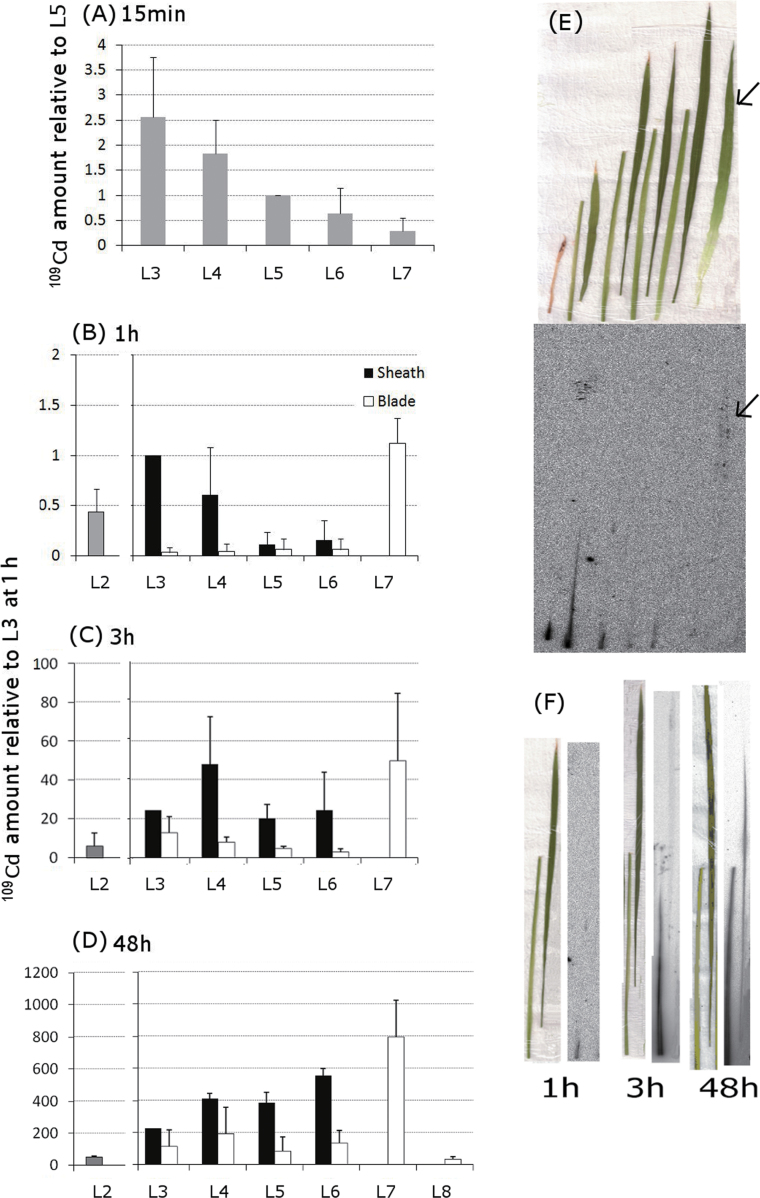
Fig. 2.
Time-dependent changes in the distribution pattern of 109Cd in each organ. (A) The amount of 109Cd in the leaves at 15min was measured using a gamma counter and normalized to that of L5. (B–D) 109Cd signals in the sheath and blade of each leaf were analysed at 1 (B), 3 (C), and 48h (D) after the initiation of treatment. Signal intensities, based on the photostimulated luminescence values for each organ, were normalized to those of the L3 sheath within each plant. Amount of 109Cd relative to that in the L3 sheath at 1h was presented. Error bars correspond to standard deviation from three biological repeats. Experiments were performed at least twice, providing similar results. (E) Typical distribution pattern of 109Cd detected by an imaging plate at 1h (bottom panel) is shown together with a photograph of the organs analysed (top panel). Samples were positioned in order from L2 (far left) to L7 (far right). L3, L4, L5, and L6 were separated into sheaths (left) and blades (right). Arrows are appended to assist the recognition of 109Cd signals in L7. (F) Images of the distribution pattern of 109Cd in L4 at 1, 3, and 48h after the initiation of treatment. For each time point in (F), the photograph on the left corresponds to the image on the right. Within each panel, the organs are arranged with the sheaths on the left and the blades on the right. Experiments were performed at least twice, providing similar results (this figure is available in colour at JXB online).

