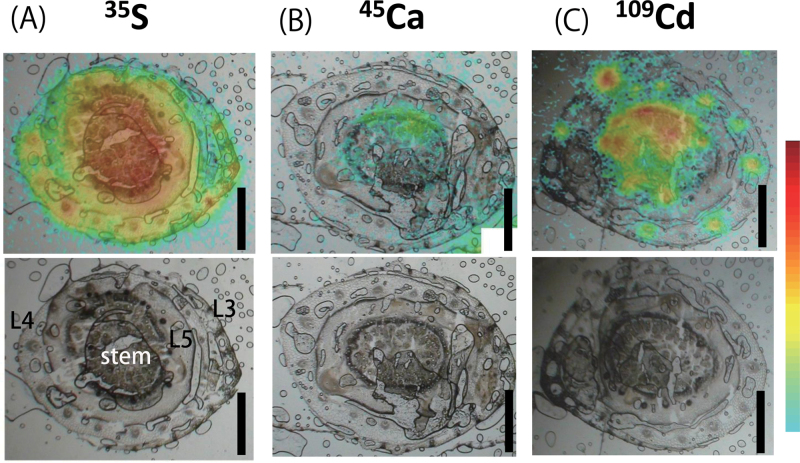
Fig. 3.
Distribution patterns of 35S (A), 45Ca (B), and 109Cd (C) in tissues of the bottom part of the shoot 15min after the initiation of treatment. Signals from tracers detected by the imaging plate are illustrated by a heat map superimposed on the corresponding bright-field image of the section (top row). The bottom row shows the original bright-field images. Bars, 1mm.

