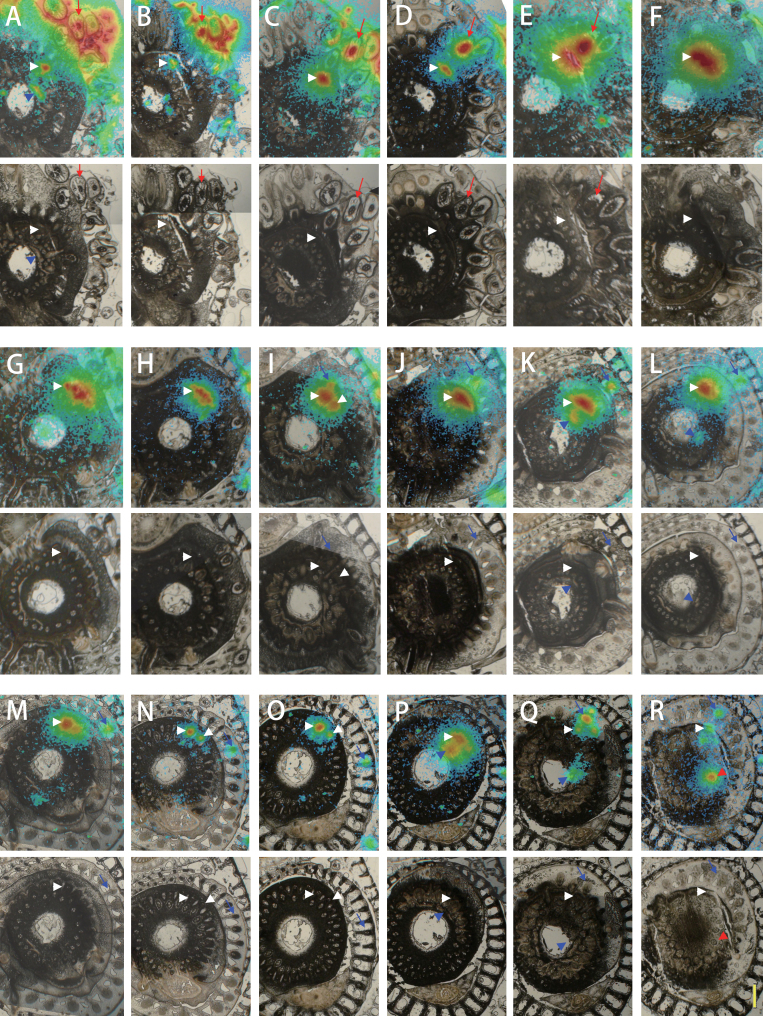
Fig. 5.
Serial section images of a mature rice stem after applying 109Cd to one crown root for 30min. 109Cd signals are illustrated by heat maps superimposed on bright-field images (top panels). The original bright-field images are shown in the bottom panels. The positions of the sections illustrated in (A–R) correspond to the incision lines indicated in Fig. 4. 109Cd signals found in the centre of the treated crown root (red arrows), peripheral cylinder of longitudinal vascular bundles in the stem (white arrowheads), nodal vascular anastomoses (blue arrowheads), the small vascular bundle heading to the leaf (blue arrows), and the large vascular bundle (red arrowheads) are marked as noted. Bar = 1mm.

