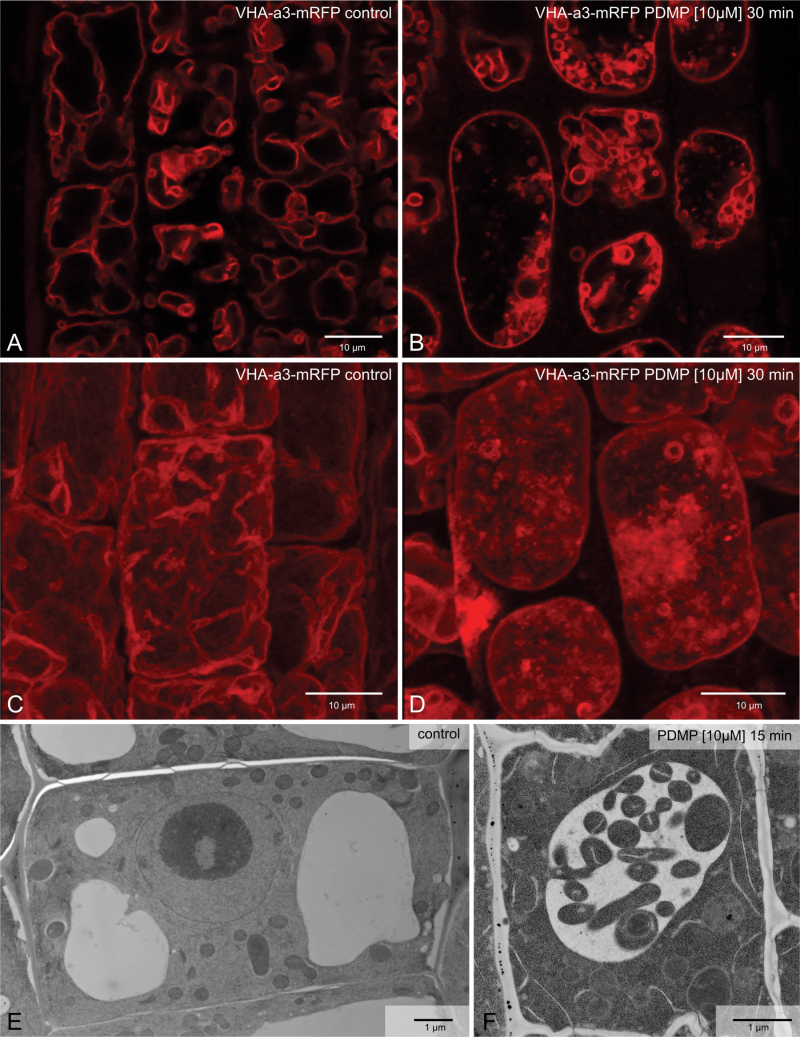
Fig. 1.
PDMP effects on the vacuole of Arabidopsis root cells. (A, C, E) Control cells; (B, D, F) cells after 30min exposure to 10 µM PDMP. (A–D) Tonoplast visualized by the presence of the fluorescent marker VHA-a3-mRFP: (A, B) single optical sections; (C, D) maximum projections of individual z-stacks. (E, F) High-pressure frozen cells. Bars, 10 µm (A–D) and 1 µm (E, F).

