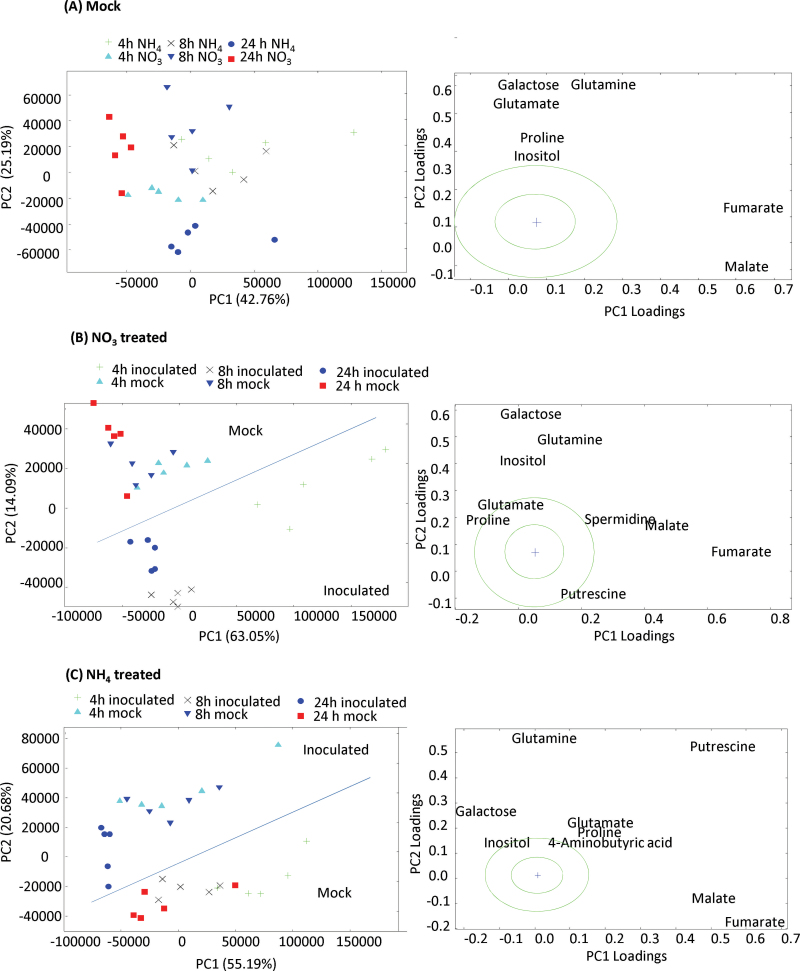
Fig. 5.
Identifying metabolite changes occurring in  or
or  in tobacco leaves following inoculation with Psph. Results are shown for PCA of 150 metabolites detected by GC-MS in
  -fed and
  -fed tobacco leaves following infiltration with 10mM MgCl2 (mock inoculated) (A), and
  -treated and Psph challenged plants (B) or
  -treated and Psph challenged plants (C). In each case, samples were analysed at 4, 8, and 24h following inoculation. In (B) and (C), clear separation between mock- and Psph-inoculated plants is delineated and labelled. In (A–C), the loading vectors (listed in Supplementary Table S1) used for the corresponding PC1 and PC2 are plotted. The ‘+’ marks the zero point where loading vectors associated with metabolites make no contribution to the plot shown in (B), whilst the circles correspond to 1 and 2 SD from this zero point. Thus, the metabolites that are major sources of variation are shown.

