Fig. 4.
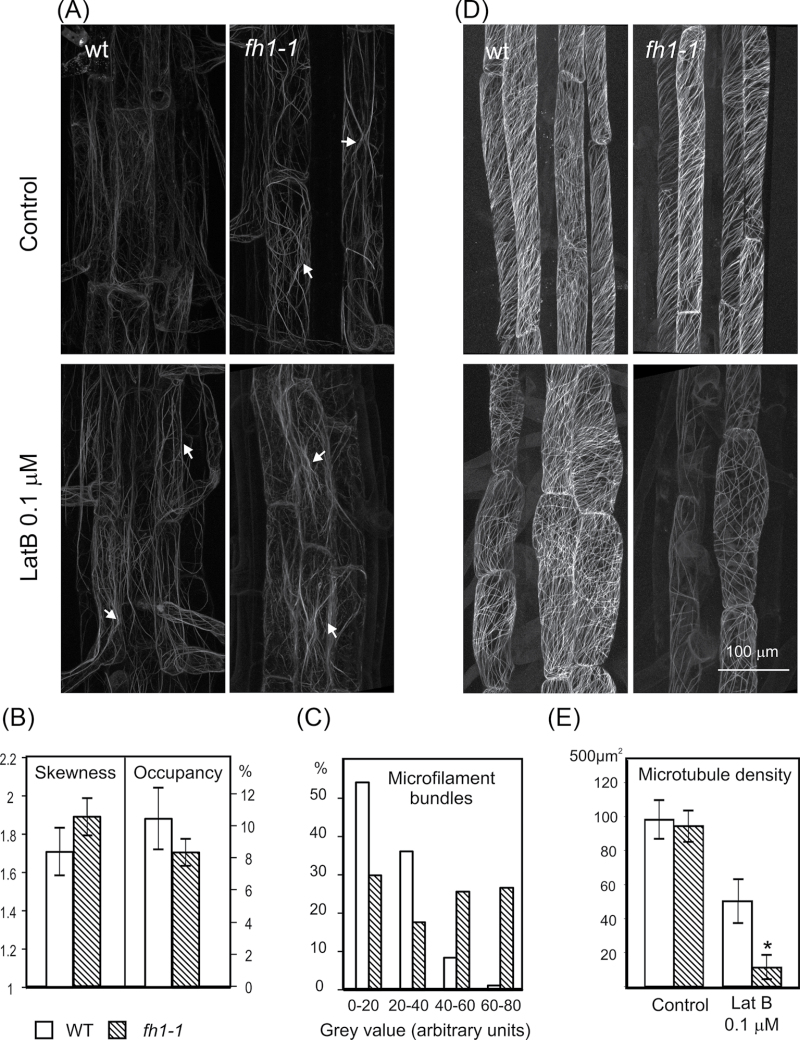
Typical cytoskeleton organization in the rhizodermis of fh1-1 mutant and wt seedlings. (A) Actin labelled by GFP–FABD; arrows, actin filament bundles. (B) Actin filament bundling (skewness) and density (occupancy) under control conditions. (C) Frequency distribution of actin fluorescence peaks in four fluorescence intensity classes under control conditions. (D) Microtubules labelled by GFP–MAP4. (E) Microtubule density. Significant differences (t-test P < 0.001) are marked by an asterisk.

