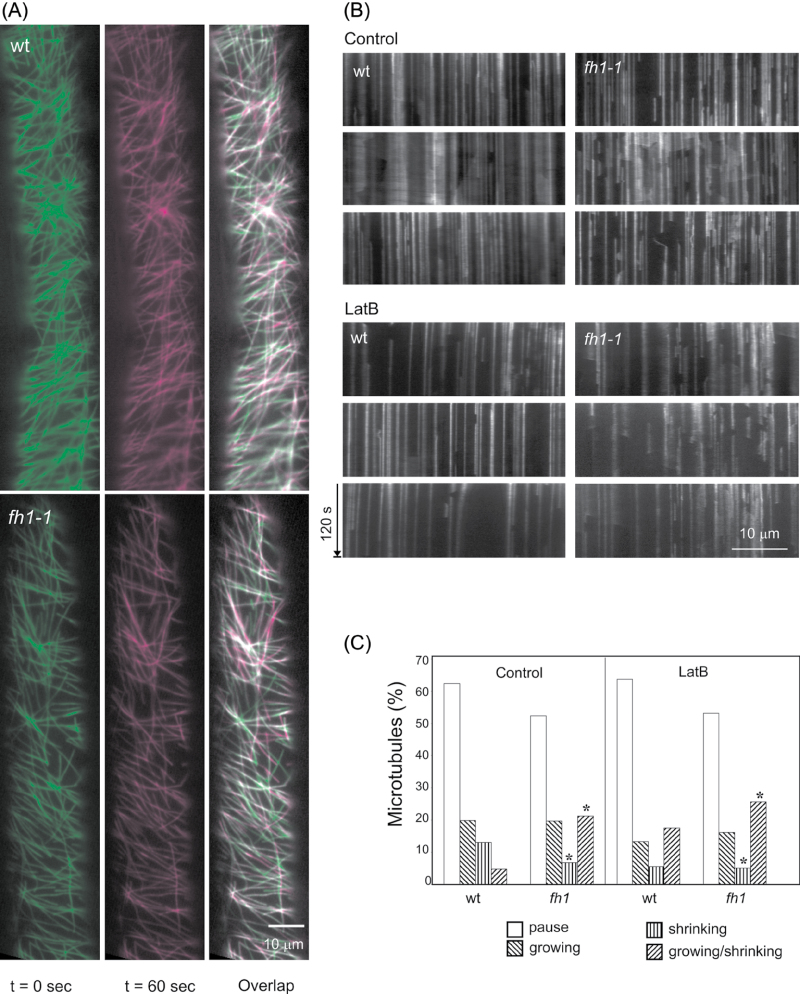
Fig. 6.
GFP–MAP4-tagged microtubule distribution and dynamics in fh1-1 mutant and wt rhizodermis. (A) VAEM images from two time points and their overlap showing growing microtubules in magenta, shrinking in green, pausing in light green, and growing/shrinking in light magenta. (B) Kymographs of microtubule dynamics under control conditions and on 0.1 µM LatB-supplemented medium. (C) Distribution of microtubule phases on control and 0.1 µM LatB-containing media. An asterisk indicates a significant difference between mutants and the wt (t-test P < 0.0001).

