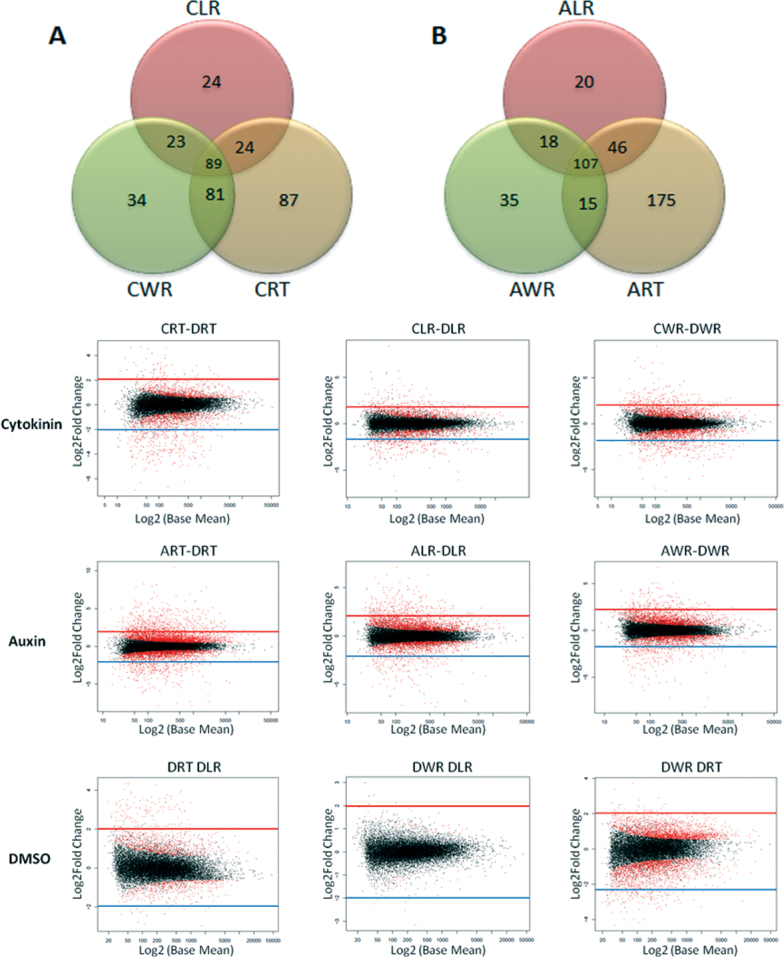
Fig. 1.
Differential expression of genes in tomato root tip (RT), lateral root (LR), and whole root (WR). Treatment of root regions are noted as prefixes (C, cytokinin, BA; A, auxin, NAA; D, DMSO). (A, B) Venn diagrams illustrating differentially expressed and significantly induced genes in tomato root either between or unique to specific tissues; gene details are presented in Table 1 and Supplementary Tables 1 and 2. (C) MvA differential expression analysis plots indicating genes’ log2 fold-change versus the log2 base mean for root tissues treated with cytokinin, auxin, and DMSO control. Genes with >2.0 log2 fold-change values were identified as differentially regulated as noted in plots by lines (red, induced; blue, repressed). Significantly differentially expressed genes are red dots (P adj ≤ 0.05)

