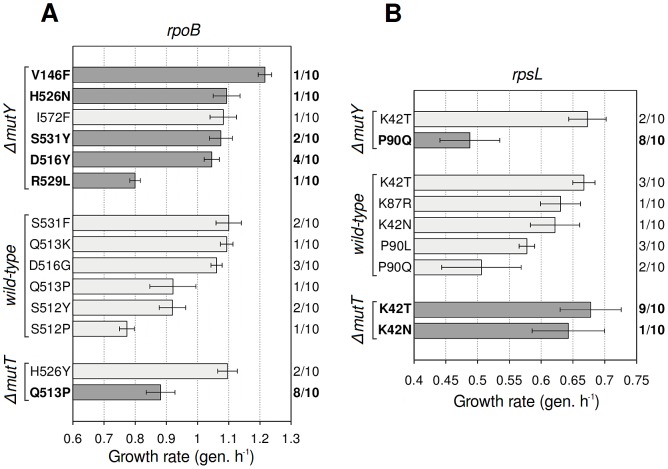
Figure 2. Antibiotic resistance mutations generated by wild-type and mutator strains.
Growth rate (mean ± SD; n = 3) of mutants bearing the specified mutation. Dark grey bars indicate mutations corresponding to the mutational spectrum of each mutator. Frequency of occurrence of each mutation is shown (right axis). All substitutions observed are described to confer antibiotic resistance. (A) Mutations in rpoB, which confer rifampicin resistance. (B) Mutations in rpsL, which confer streptomycin resistance.

