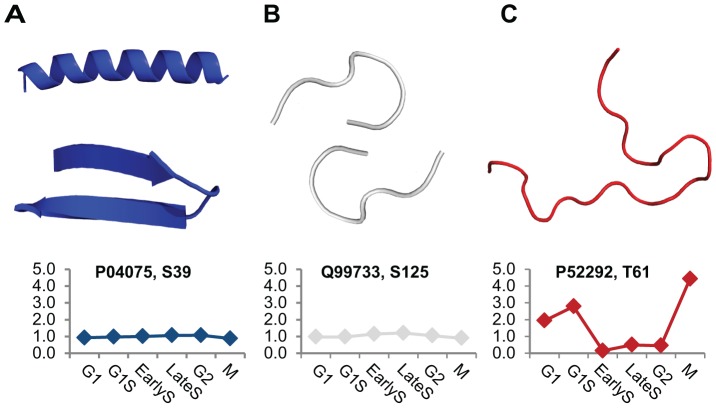
Figure 1. Temporal phosphorylation patterns of phospho-sites with distinct structural properties.
Phosphorylation fold changes of three sites (UniProt accession number and residue identification number are given) during the six time points is shown together with their corresponding local structure. From left to right the phosphorylation variation over the six time points increases, together with the level of disorder: from (A) regular secondary structure (α-helix or β-sheet) through (B) irregular coils and loops to (C) disordered regions. Phospho-serine residues (pS) within regular regions and loops show small fluctuations in their phosphorylation levels, while larger changes occur in disordered regions.

