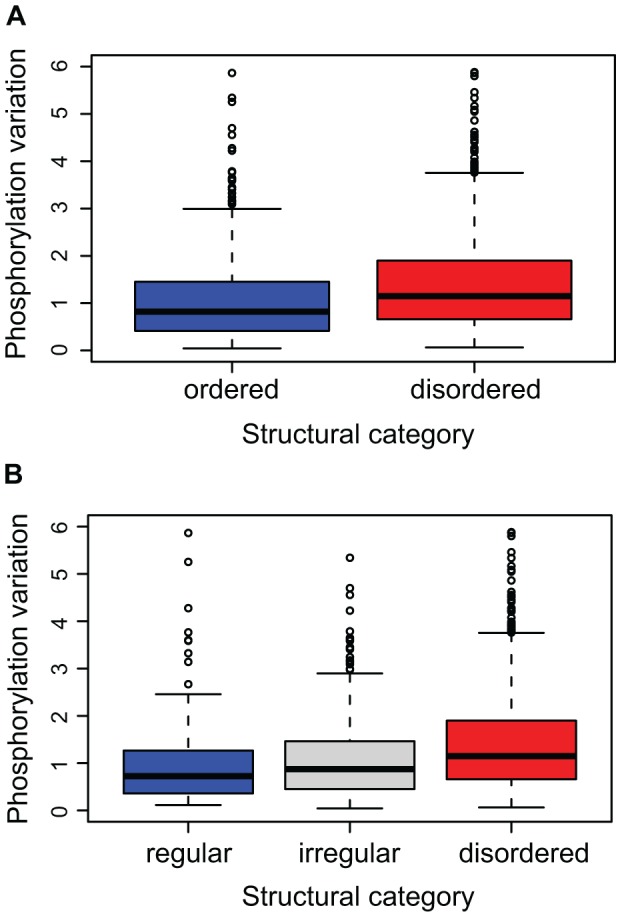
Figure 2. Comparison of phosphorylation variation of sites within different structural categories.

A) Sites within ordered regions (blue) show smaller variation of the phosphorylation fold change over the cell cycle than those within disordered regions (red). The significance of the observation has been tested with Kolmogorov-Smirnov test (p-value 6.6E-13). (B) The variation of phosphorylation changes over the cell cycle scales with the structural propensities of the phosphorylated residues: from lowest in regular structures (blue) to highest in disordered regions (red). The observed differences were found to be significant by ANOVA test (p-value 3.02E-09).
