
Figure 4. Conservation of phosphorylated sites versus conservation of control sites taking into account local structure.
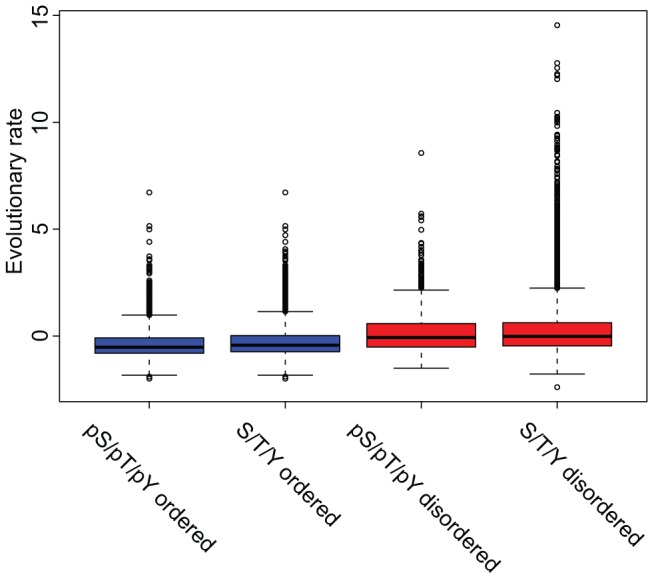
Lower values correspond to slower evolutionary rate and higher conservation. Phosphorylation sites predicted to lie within regular structures (in blue, pS/pT/pY regular) appeared to be more conserved than their equivalent non-phosphorylated residues from the same proteins (p-value 2.24e-16). The same tendency was present for modified sites in disordered regions (in red, pS/pT/pY disordered), which were also subjected to a statistically significant slower evolutionary rate than their control set (p-value 3.4E-03). Phosphorylation sites in regular structures showed higher conservation than that of phosphorylation sites in irregular structures (p-value 3.23E-120).