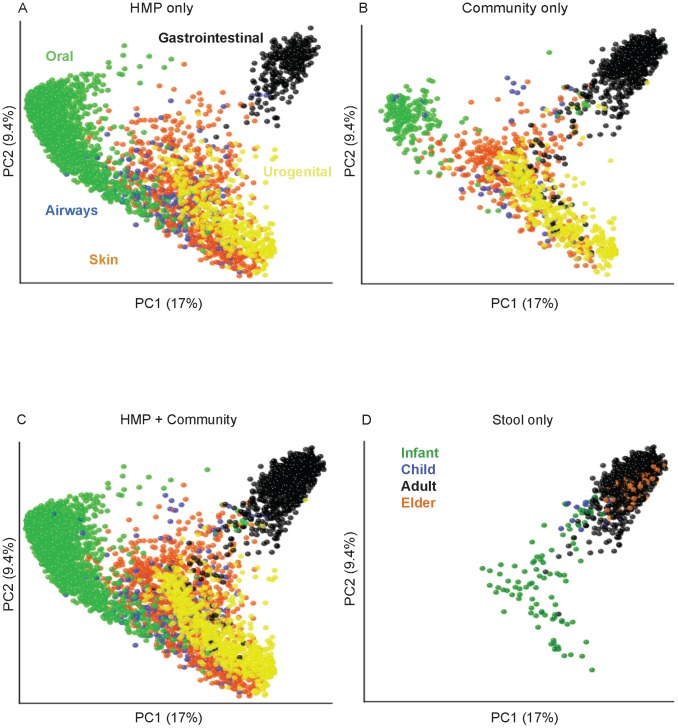
Figure 1. Bacterial diversity clusters by body habitat.
A–C: All body sites. The two principal coordinates from the PCoA analysis of the unweighted UniFrac distances are plotted for (A) HMP data; (B) community data (see Table S1 for list of studies), (C) both datasets combined. Symbol colors correspond to body sites as indicated on panel A. Panel D shows gut samples (majority are fecal) divided into infants (green), children (blue), adults (black) and elderly (orange) samples. The variance explained by the PCs is indicated in parentheses on the axes.

