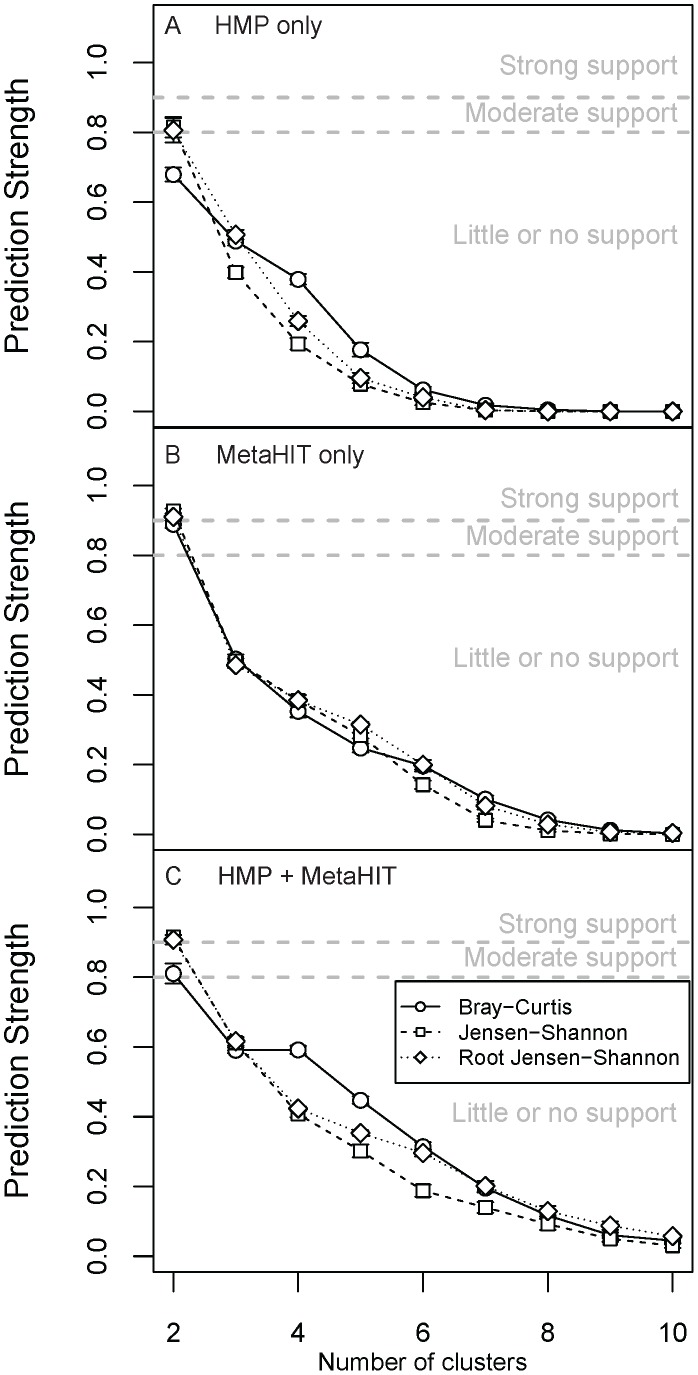
Figure 6. Prediction scores for enterotypes in fecal samples using WGS data.
Prediction strength scores calculated using 3 distances metrics for (A) HMP, (B) MetaHIT and (C) HMP + MetaHIT data. The thresholds for significance of clustering scores are indicated as dashed lines on the plots. Bars are standard errors.

