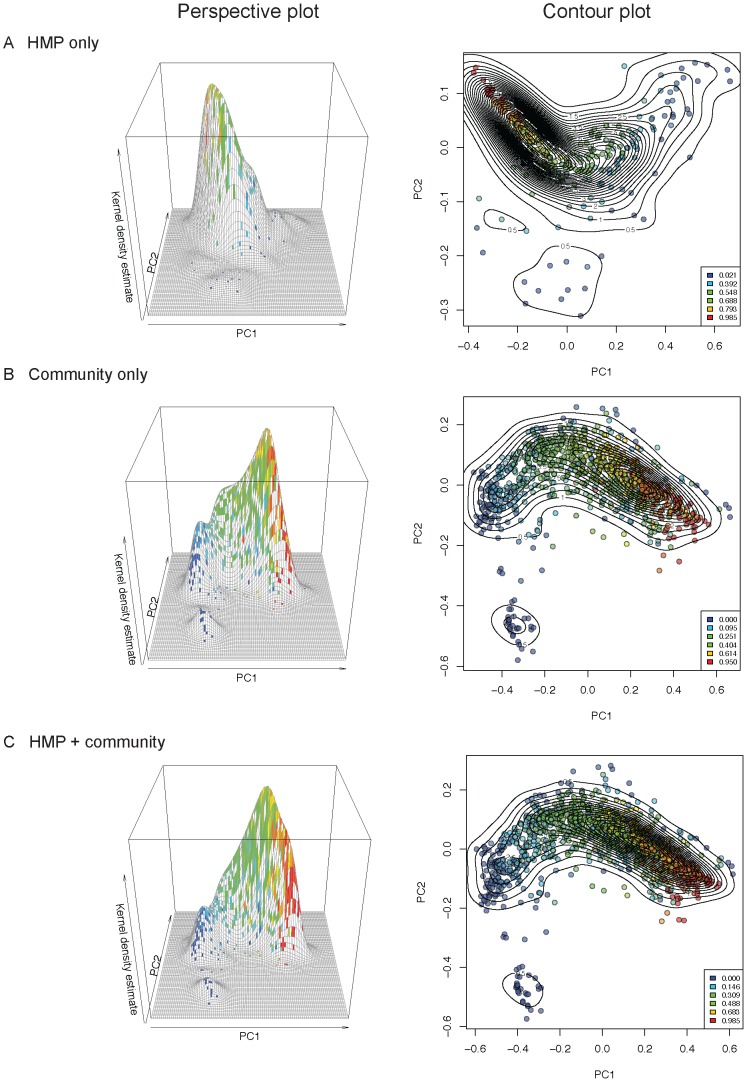
Figure 8. The fecal microbiota exhibit a smooth gradient of Bacteroides abundances across samples from the HMP and community studies.
Bacteroides abundances are mapped onto the first two principal coordinates of the weighted UniFrac PCoA analysis for HMP data (A), community data (B), and combined HMP and community data (C). Left panels: 3D plots showing kernel density estimates mapped onto PC1 and PC2; Right panels: contours indicate sample densities, sample colors indicate Bacteroides relative abundances ranging from 0–1, where 1 = 100% Bacteroides; color levels are determined by quantiles to allow visual comparison of any distribution of relative abundances (e.g., 0% of samples fall below the first threshold, 20% below the second threshold, 40% below the third, etc.)

