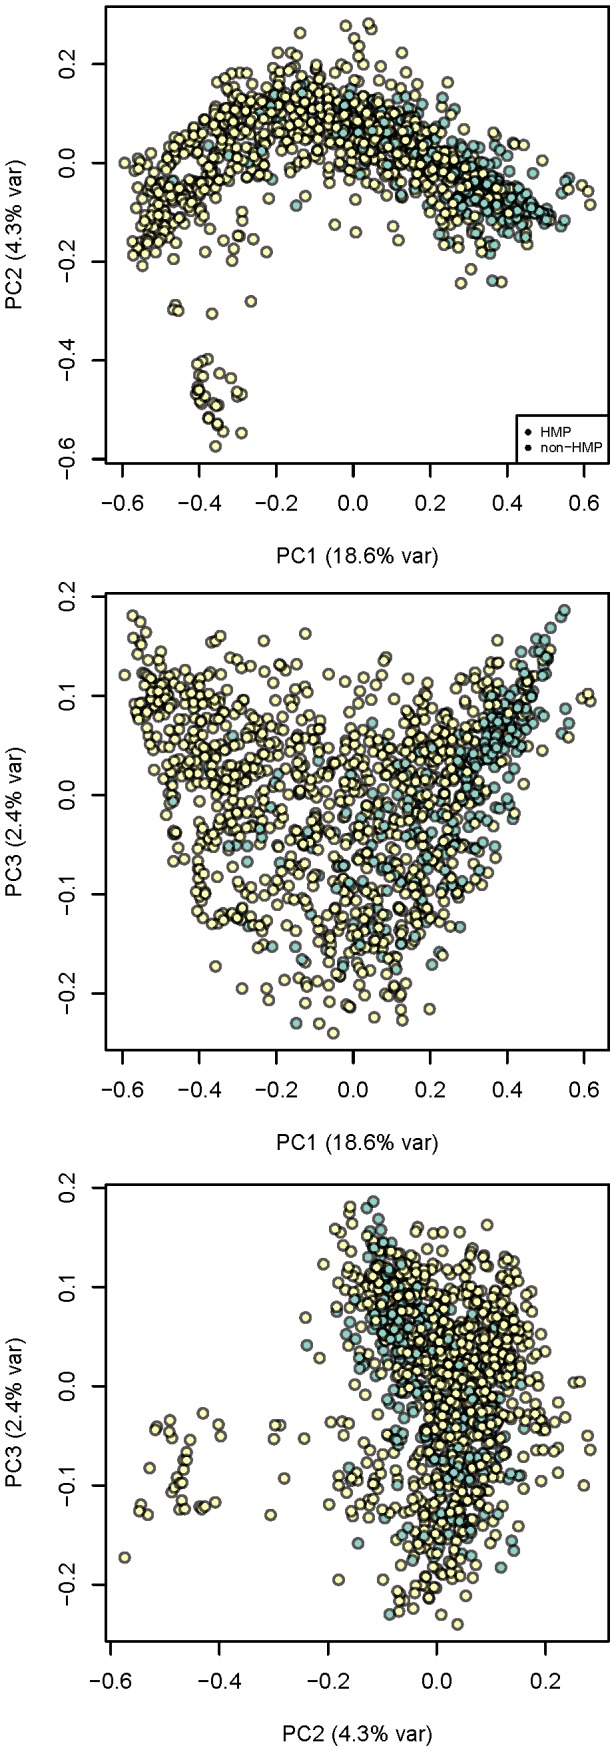
Figure 9. HMP fecal samples are slightly enriched in Bacteroides abundances compared to community samples.

The projection from Fig. 8C, right panel, is colored to show if samples originate from the HMP (blue) or community (yellow), and all PC combinations are shown. See Fig. 8 for description of the axes.
