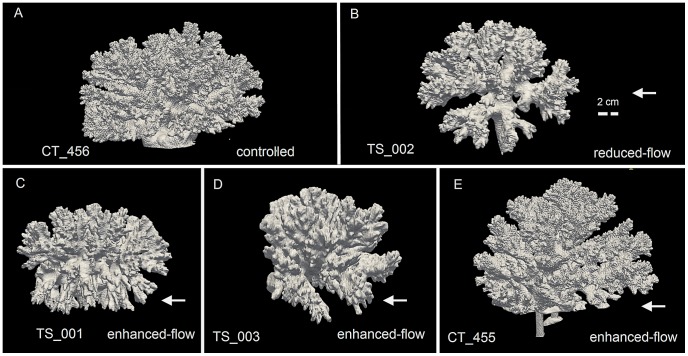
Figure 1. Computed Tomography (CT) scans of scleractinian coral Pocillopora verrucosa.
(A) A controlled coral exposed to ambient current with the average near-bottom velocity of 5 cm s−1 [46]. (B) A coral that was grown in an in situ controlled flume setup with “reduced flow” condition (∼1 cm s−1) (C–E) Corals were grown in the in-situ controlled flumes setup with “enhanced flow” condition (15–20 cm s−1) [32]. Arrows indicate flow direction. The labels of the CT scans are located at the bottom of each figure (see Table 1).

