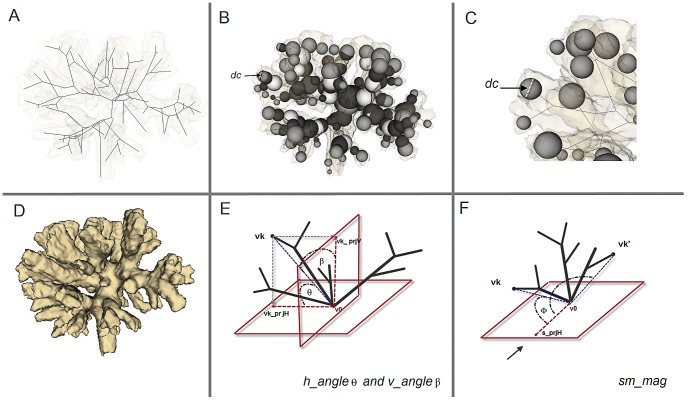
Figure 5. Morphometric methods.
(A) A skeleton graph with the increased level of occlusion of the volumetric data in the background, (B–C) Visualization of spheres used for calculating morphometric traits - diameter of a sphere at the terminal branch is defined as terminal branch thickness –dc, (D) A visualization of the volumetric data of TS_002 coral (See Table 1 for label), (E) Visualization of symmetry angles hangle
 and vangle
 , (F) Visualization of the associated vectors used for calculation of symmetry vector smmag.

