Figure 1.

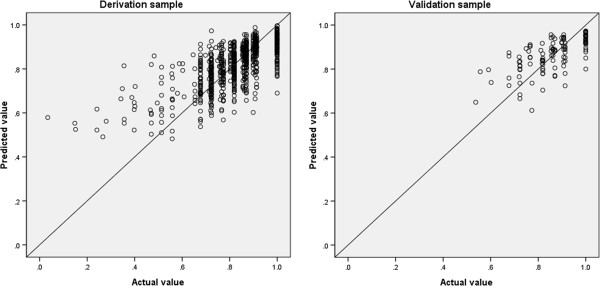
Scatter plot of predicted values based on Model 2 parameters versus the actual EQ-5D index. A perfect fit is indicated by the 45° reference line.

Scatter plot of predicted values based on Model 2 parameters versus the actual EQ-5D index. A perfect fit is indicated by the 45° reference line.