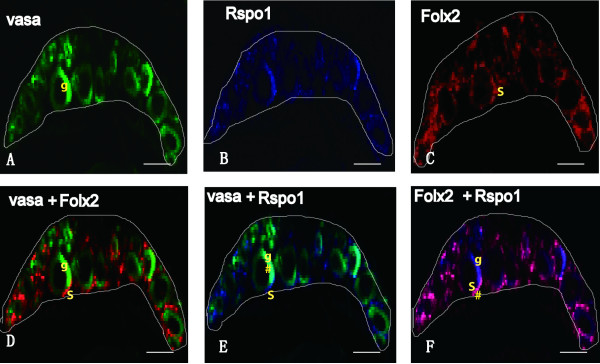
Figure 6.
Localization of Vasa, Rspo1 and Foxl2 in 10dah XX gonads. RNA probes were labeled with FITC, DIG or Biotin, respectively. Stained sections were observed under a confocal laser microscope. Photographs in A-F show the same area of the XX gonad. The upper panels were the signals of Vasa (green) in the germ cells (A), Rspo1 (blue) (B) and Foxl2 (red) in the somatic cells (C). The lower panels were the signals of two genes by overlapping. D: Vasa and Foxl2; E: Vasa and Rspo1; F: Rspo1 and Foxl2. The # in E indicates co-localization of Vasa and Rspo1 in the germ cells. The # in F indicates co-localization of Foxl2 and Rspo1 in the somatic cells. g indicates germ cell and S indicates somatic cell. The boundary of gonad is marked by white color lines.

