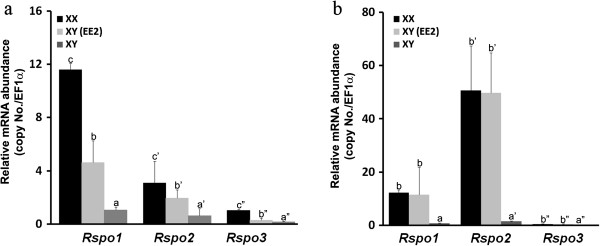
Figure 7.
(a) Changes of the expression profiles of Rspo1, 2 and 3 after EE2 treatment at 0dah (n = 15). (b) Effect of EE2 treatment on Rspo1, 2 and 3 expression in adult XY fish (n = 6). Values (mean ± S.E.) represent the relatively mRNA abundance of Rspo1, 2 and 3. Values with different letters indicate significant difference (P < 0.05) of each gene. (XX, control; XY-EE2, treated group; XY, control).

