
Fig. 1.
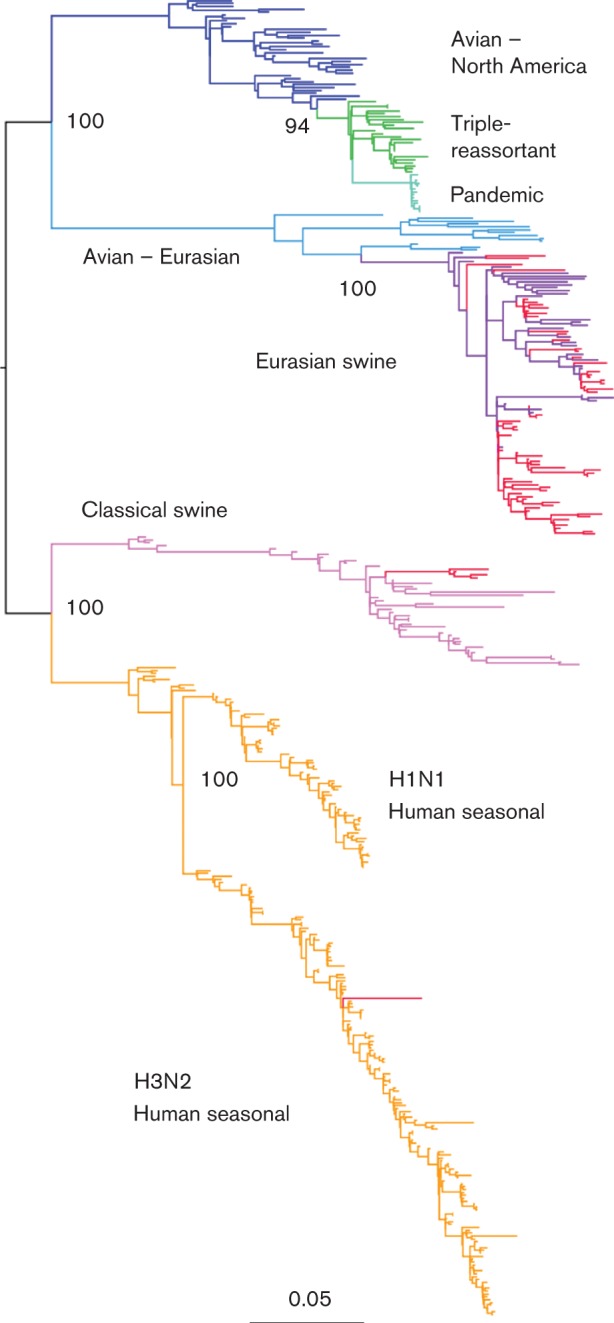
Maximum-likelihood tree for PB2 sequences. The branches of the tree have been coloured according to clade: human seasonal, orange; classical swine, pink; avian Eurasian, pale blue; Eurasian swine, purple; avian North America, dark blue; triple-reassortant swine, green; H1N1v pandemic, turquoise. Swine sequences generated as part of this study are coloured red, and the bootstrap support for selected nodes is shown. Bar, 0.05 nucleotide substitutions per site.