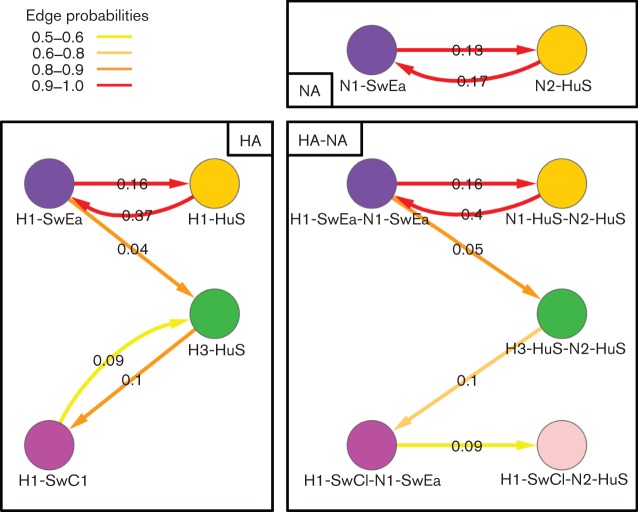
Fig. 4.
Significant rates for reassortments (expressed as exchanges year−1) onto the PB2 backbone, calculated using beast discrete traits. HA only (left), NA only (top right) and HA-NA joint (bottom right) traits results are shown. The detailed subtype abbreviations are as for Fig. 2. Only those edges with a probability of existing in the trees sample ≥0.5 and Bayes factor ≥4 are shown, and the colour reflects the support for the edge ranging from red (strongest) to yellow (just significant). The edge values are median transition rates.

