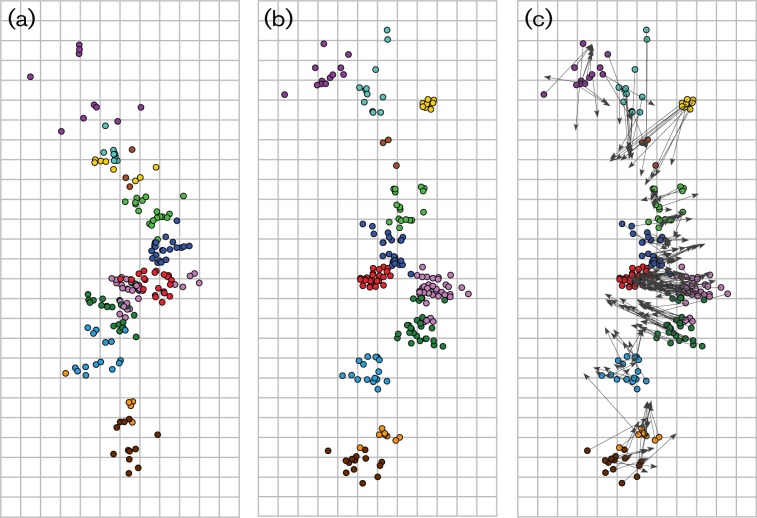
Fig. 2.
Genetic maps of the major glycoproteins of human influenza A (H3N2) viruses. Genetic maps were generated with 291 aa sequences and multidimensional scaling (MDS) algorithms for NA (a) and HA1 (b). The vertical and horizontal axes correspond to the number of amino acid substitutions; one square represents five amino acid substitutions. The orientation of the HA1 and NA maps was chosen to match the orientation of the antigenic map of human influenza A (H3N2) viruses (Smith et al., 2004). The colour coding of viruses is based on the antigenic clusters of HA and is consistent among all maps (see legend to Fig. 1). The map in panel (c) depicts the HA genetic map with superimposed arrows pointing towards the corresponding data points in the NA genetic map.

