
Fig. 3.
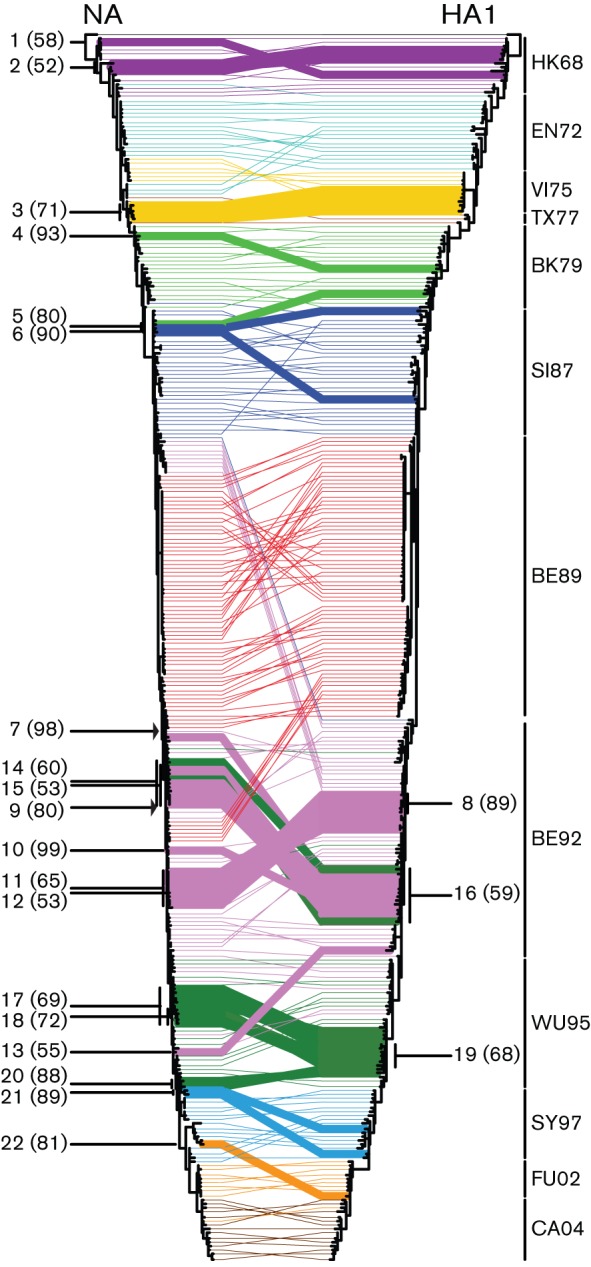
Reassortment events between NA and HA1 during 42 years of influenza A (H3N2) evolution. TreeMap version 1.0 was used to generate a tanglegram with the phylogenetic ML trees shown in Fig. 1. Twines between both trees were colour coded according to the antigenic clusters of HA (Smith et al., 2004; see legend to Fig. 1). GiRaF version 1.01 (Nagarajan & Kingsford, 2011) was used to detect reassortment events between HA and NA. Reassortment events (Table S1) reported in ≥50 % of the cases are indicated in bold, with percentages shown in parentheses. The arrows indicate the introduction of an NA that represents the common ancestor of all more recent NAs.