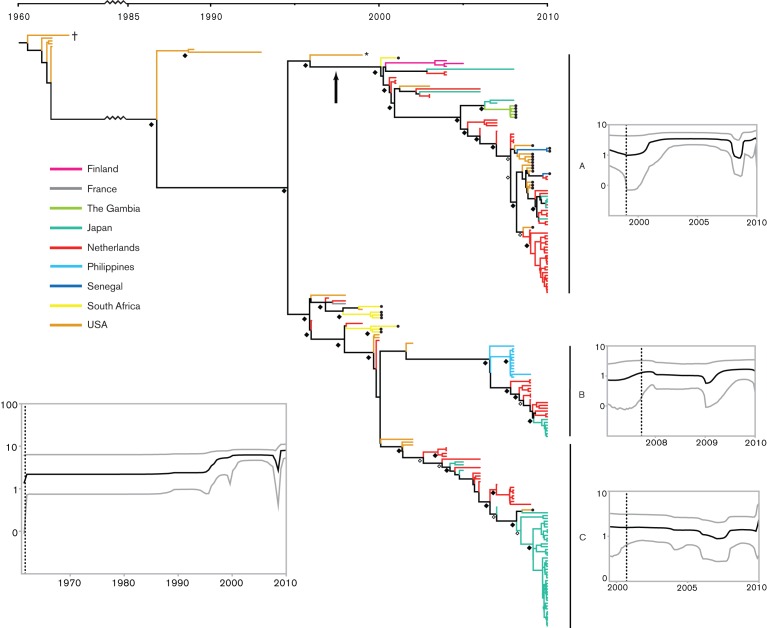
Fig. 1.
Evolutionary history of EV-D68 based on complete VP1 sequences. The maximum clade credibility tree is shown with BPP values of 0.7–0.8 and 0.9–1.0 indicated by ⧫ and ◊ at the nodes, respectively. Clades A, B and C are indicated and supported by BPP = 1.0. The Bayesian skyline plots (BSPs) are shown for the overall dataset (bottom left) and for clades A, B and C. The black line indicates the median relative genetic diversity (log10 scale) over time and the grey curves represent the upper and lower 95 % HPD intervals. • at the tips of the branches indicates novel sequences generated in this study. The vertical arrow indicates the branch along which the VP1 asparagine deletion occurred; † indicates the Fermon strain (1962), and * indicates the initial clade A strain from Maryland, USA (1999).

