Fig. 1.
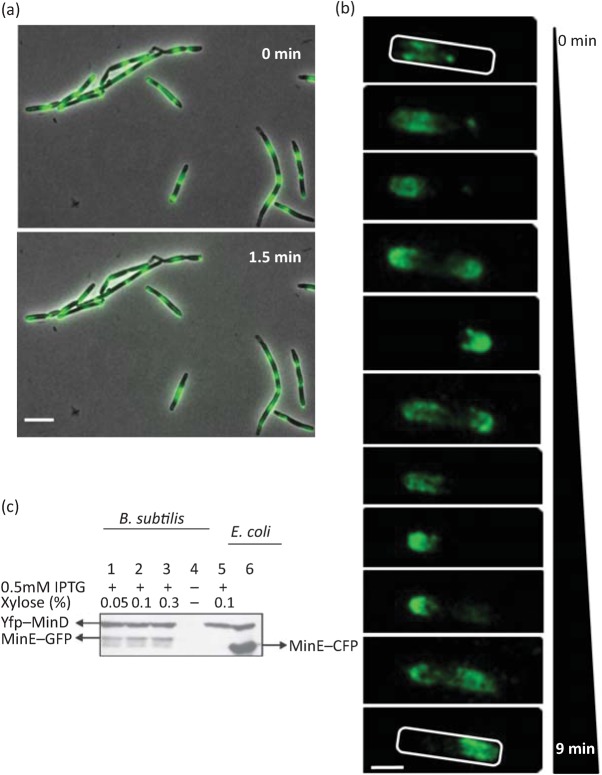
E. coli MinD can oscillate in the presence of MinE in B. subtilis. (a) Fluorescence micrographs showing localization of YFP–MinDEc in B. subtilis strain IB1242 (ΔminDBs ΔdivIVA yfp–minDEc minE). In most cells, oscillation of YFP fluorescence could be observed, although in some cells the fluorescence signal appears in the form of dots with reduced mobility. The images were taken with an Olympus BX61 microscope. Two pictures were taken 1.5 min apart. Scale bar, 5 µm. (b) Localization of YFP–MinDEc in a single cell of strain IB1230 (ΔminDBs yfp–minDEc minE). Images were captured using an Olympus BX61 microscope over a period of 9 min and the frames were deconvolved using Huygens Essential software. Scale bar, 1 µm. (c) Relative quantification of YFP–MinD (upper band) and MinE–GFP (lower band, lanes 1–3) in B. subtilis and MinE–CFP (lower band, lane 6) in E. coli by Western blotting. Anti-GFP antibody was used for detection of YFP–MinD, MinE–GFP and MinE–CFP. Lanes 1–3 represent B. subtilis strain IB1155 (ΔminDBs yfp–minDEc minE–gfp) in which expression of yfp–minD is induced with 0.5 mM IPTG and minE–gfp is induced with three different concentrations of xylose, ranging from 0.05 to 0.3 %. Lane 4 represents a negative control, strain IB1056 (ΔminDBs). Lane 5 is strain IB1230 (ΔminDBs yfp–minDEc minE) with expression induced using 0.5 mM IPTG and 0.1 % xylose. Lane 6 represents E. coli strain YLS1 : : pYLS68 grown as described elsewhere (Shih et al., 2002).

