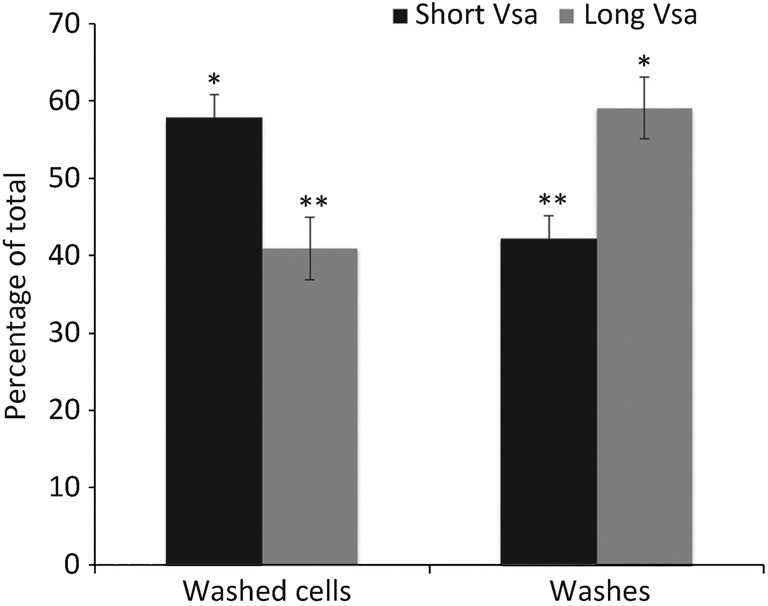
Fig. 2.

Distribution of EPS-I for the long VsaG-producing strain CTG38 and the short VsaG-producing strain CTG-R5 (n = 2), showing the relative amount of EPS-I associated with washed cells and the washes. The values are represented as a percentage of the total polysaccharide (washed cells plus the washes). Means with the same number of asterisks were not significantly different from each other, but there were significant differences between means with a different number of asterisks. Error bars, sem.
