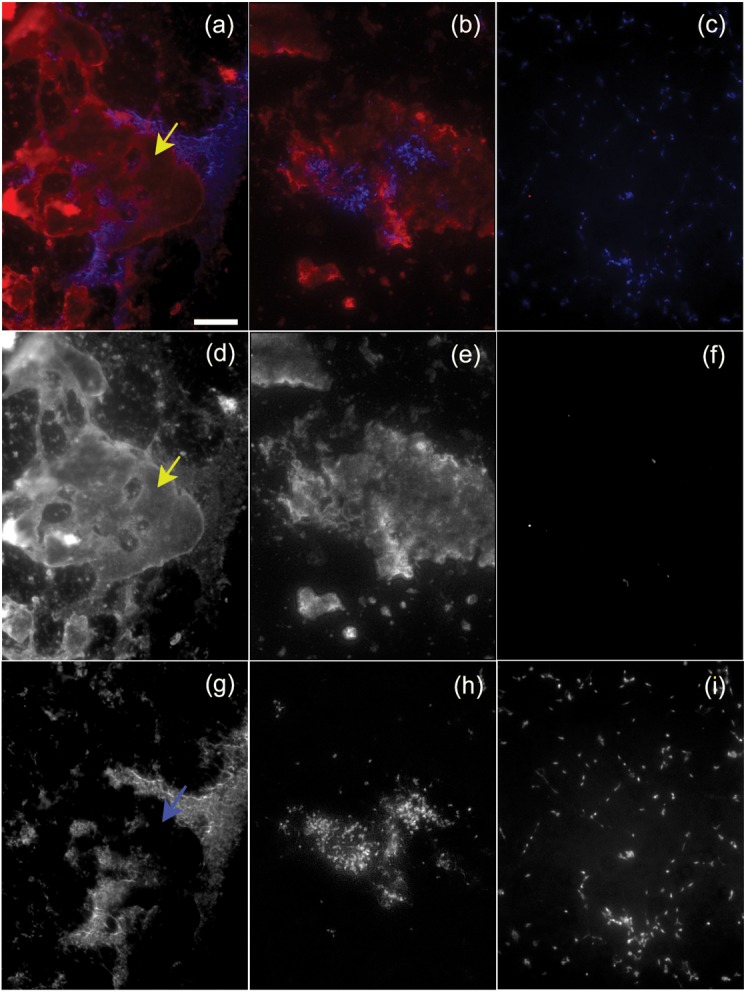
Fig. 4.

Complement deposition on strain CTp12. (a, b and c) Localization of C3 (shown in red) relative to the mycoplasma cells stained with Hoechst (shown in blue). (a, b) Strain CTp12 incubated with mouse serum; (c) CTp12 incubated with HIA-mouse serum. (d, e and f) Separate immunofluorescent signal for C3 localization; (g, h and i) separate fluorescent signal for DNA localization. The yellow arrows in (a, d) show an area where material binds to C3 and is devoid of cellular material, as shown by the blue arrow in (g). The area represented by the mycoplasma cells (g, h) is smaller than the area where C3 is deposited (d, e). (b, e and h) Composite images showing the extended depth of field. The mycoplasma cells incubated with HIA-mouse serum did not bind C3 (c, f, i). Scale bar, 25 µm for all panels.
