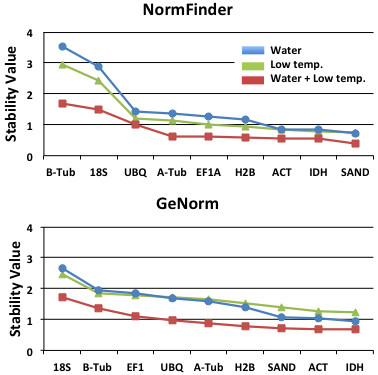
Figure 1.
The stability values of the genes calculated according to the two software programmes used in the analyses of the most stable genes. The graph shows the analyses differentiating the water stress treatments (control + water stress + water stress recovery), the temperature treatments (control + low temperature), and both treatments together, regardless of species or tissue types (apex and base).

