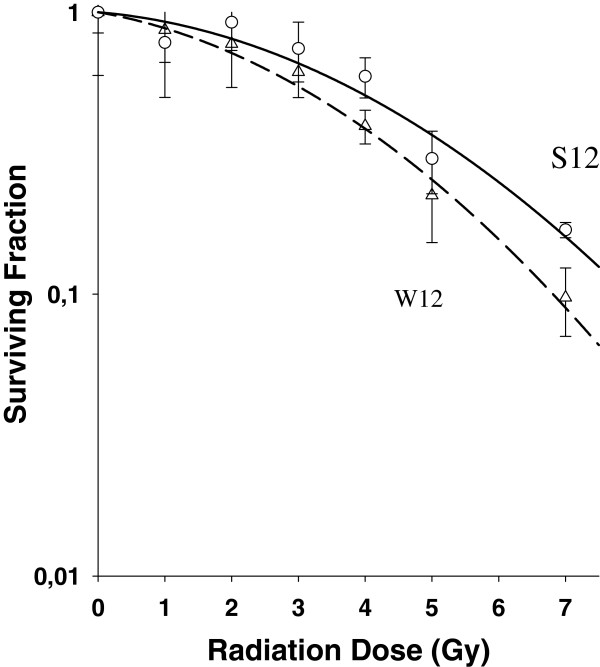
Figure 1.
Survival curves (Sigma Plot 8.0) of W12 cells (intact E2-gene) compared to S12 cells (disrupted E2-gene). Legend 1: Clonogenic survival was analyzed by using 96-well in vitro test. The E2 gene of S12 cells (passage 88 – 103) was disrupted in the E2C region. W12 cells (passage 8 –14) with an intact E2 gene showed a higher radiosensitivity with a radiation enhancement factor of 1.5 (4 Gy).

